# Visualizing sets of boundary mesh points as lines
**URL:** https://discourse.paraview.org/t/visualizing-sets-of-boundary-mesh-points-as-lines/3120
**Category:** ParaView Support
**Created:** [December 5, 2019, 4:17am UTC](https://discourse.paraview.org/t/visualizing-sets-of-boundary-mesh-points-as-lines/3120 "2019-12-05T04:17:43Z")
**Posts on this page:** 4
**Page:** 1
### Author:  [@parajan](https://discourse.paraview.org/u/parajan)
#### Post date: [December 5, 2019, 4:17am UTC](https://discourse.paraview.org/t/visualizing-sets-of-boundary-mesh-points-as-lines/3120/1 "2019-12-05T04:17:43Z")
I have a csv file with 3 columns. The first and second columns are x,y coordinates of mesh boundary points. The third column is an integer that tells which boundary the point is a part of.
Here is an example file: [boundaries.csv](https://discourse.paraview.org/uploads/short-url/iP1ae1Z7EaMBR6w5t07uz7LfMWo.csv) (2.4 KB)
I would like to visualize the boundaries as distinct lines. So far I have only gotten them to show as sets of differently colored points using the TableToPoints filter by activating the “2d” and “Keep All Data Arrays” options:
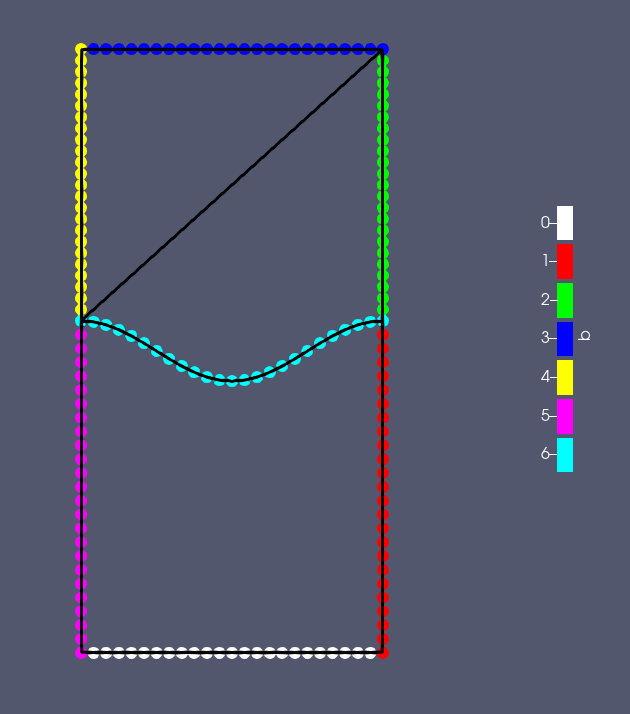
With a python script for the programmable filter from here: [https://public.kitware.com/pipermail/paraview/2014-March/030781.html](https://public.kitware.com/pipermail/paraview/2014-March/030781.html), I managed to add the black lines.
For completeness, the script is:
```
pdi = self.GetPolyDataInput()
pdo = self.GetPolyDataOutput()
numPoints = pdi.GetNumberOfPoints()
pdo.Allocate()
for i in range(0, numPoints-1):
points = [i, i+1]
# VTK_LINE is 3
pdo.InsertNextCell(3, 2, points)
```
I would like to have separate lines from the points for each boundary. Is that possible?
if not, is it possible to extract lines based on the boundary index?
I have tried with this script:
```
pdi = self.GetPolyDataInput()
pdo = self.GetPolyDataOutput()
numPoints = pdi.GetNumberOfPoints()
pdo.Allocate()
counter=0
for i in range(0, numPoints-1):
coord = pdi.GetPoint(i)
b = coord[0]
if b==6.0:
points = [counter, counter+1]
counter += 1
pdo.InsertNextCell(3, 2, points) # VTK_LINE is 3
```
But I did not find a function to access the boundary index.
---
### Author:  [@mwestphal](https://discourse.paraview.org/u/mwestphal)
#### Post date: [December 5, 2019, 9:04am UTC](https://discourse.paraview.org/t/visualizing-sets-of-boundary-mesh-points-as-lines/3120/2 "2019-12-05T09:04:54Z")
What do you mean by separate ?
Do you want to have a Cell by boundary ?
---
### Author:  [@Kenichiro-Yoshimi](https://discourse.paraview.org/u/Kenichiro-Yoshimi)
#### Post date: [December 5, 2019, 9:46am UTC](https://discourse.paraview.org/t/visualizing-sets-of-boundary-mesh-points-as-lines/3120/3 "2019-12-05T09:46:59Z")
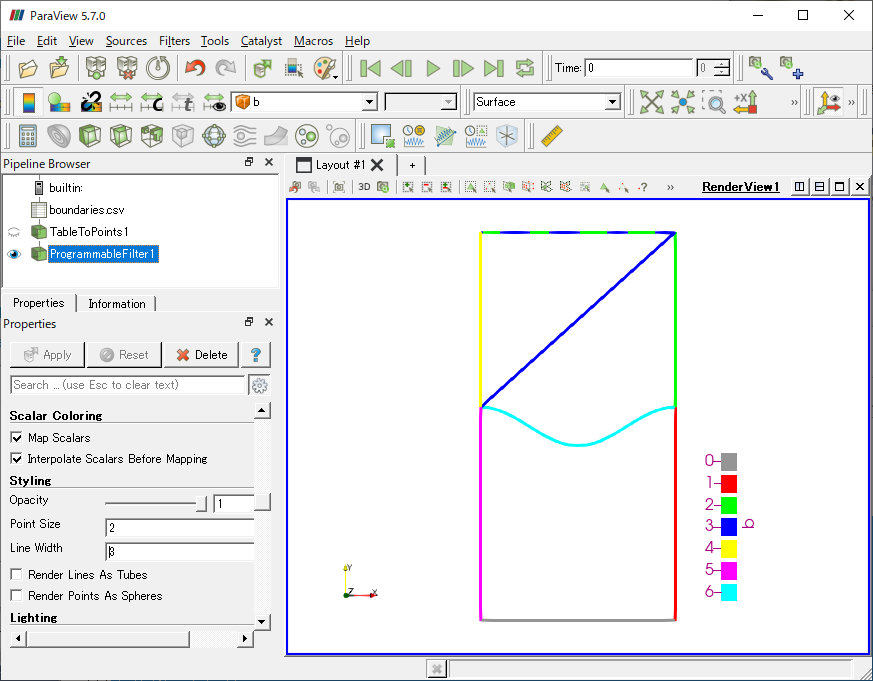
The programmable filter can simultaneously generate boundary ids as cell data with lines:
```python
pdi = self.GetPolyDataInput()
pdo = self.GetPolyDataOutput()
numPoints = pdi.GetNumberOfPoints()
pdo.Allocate()
pb = pdi.GetPointData().GetArray(' b')
cb = vtk.vtkIntArray()
cb.SetName('b')
cb.SetNumberOfComponents(1)
pdo.GetCellData().AddArray(cb)
for i in range(0, numPoints-1):
points = [i, i+1]
# VTK_LINE is 3
pdo.InsertNextCell(3, 2, points)
bid = pb.GetTuple1(i)
cb.InsertNextTuple1(bid)
```
(I don’t take care of the duplicate lines.)
---
### Author:  [@parajan](https://discourse.paraview.org/u/parajan)
#### Post date: [December 6, 2019, 4:34am UTC](https://discourse.paraview.org/t/visualizing-sets-of-boundary-mesh-points-as-lines/3120/4 "2019-12-06T04:34:03Z")
Thx that was illuminating!
One thing I struggled with is finding documentation on the available python functions.
Is there a list somewhere?
Also the duplication of lines can be avoided with:
```
pdi = self.GetPolyDataInput()
pdo = self.GetPolyDataOutput()
numPoints = pdi.GetNumberOfPoints()
pdo.Allocate()
pb = pdi.GetPointData().GetArray(' b')
cb = vtk.vtkIntArray()
cb.SetName('b')
cb.SetNumberOfComponents(1)
pdo.GetCellData().AddArray(cb)
for i in range(0, numPoints-1):
bid = pb.GetTuple1(i)
bidNext = pb.GetTuple1(i+1)
if (bid == bidNext):
points = [i, i+1]
pdo.InsertNextCell(3, 2, points)
cb.InsertNextTuple1(bid)
```