# Vorticity contour for falling sphere?
**URL:** https://discourse.paraview.org/t/vorticity-contour-for-falling-sphere/5404
**Category:** ParaView Support
**Created:** [September 23, 2020, 4:35am UTC](https://discourse.paraview.org/t/vorticity-contour-for-falling-sphere/5404 "2020-09-23T04:35:18Z")
**Posts on this page:** 8
**Page:** 1
### Author:  [@govind\_sharma](https://discourse.paraview.org/u/govind_sharma)
#### Post date: [September 23, 2020, 4:35am UTC](https://discourse.paraview.org/t/vorticity-contour-for-falling-sphere/5404/1 "2020-09-23T04:35:18Z")
How do I plot vorticity contours for a falling sphere in fluid which is initially quiescent.

---
### Author:  [@mwestphal](https://discourse.paraview.org/u/mwestphal)
#### Post date: [September 23, 2020, 6:47am UTC](https://discourse.paraview.org/t/vorticity-contour-for-falling-sphere/5404/2 "2020-09-23T06:47:51Z")
please share your data.
---
### Author:  [@govind\_sharma](https://discourse.paraview.org/u/govind_sharma)
#### Post date: [September 23, 2020, 8:49am UTC](https://discourse.paraview.org/t/vorticity-contour-for-falling-sphere/5404/3 "2020-09-23T08:49:00Z")
The figure in above is from Vislt. I want to get something this type of plot.
Here are the data files. I have run in parallel (4 procs) but data from two will be fine I think. foam1 is from processor 1, foam2 processor 2 and these two have relevant CFD data and solid is for sphere.
[foam1.csv](https://discourse.paraview.org/uploads/short-url/QlFZzbvIruCEFcTlwCuPX82Vfj.csv) (2.1 MB) [foam2.csv](https://discourse.paraview.org/uploads/short-url/h3rhzIAba1bRCHXQfLvIpGb9G1r.csv) (2.1 MB) [solid.csv](https://discourse.paraview.org/uploads/short-url/7egygrOBXOhtGSvm7SjsUO1ywEz.csv) (178 Bytes)
---
### Author:  [@Kenichiro-Yoshimi](https://discourse.paraview.org/u/Kenichiro-Yoshimi)
#### Post date: [September 25, 2020, 1:45am UTC](https://discourse.paraview.org/t/vorticity-contour-for-falling-sphere/5404/4 "2020-09-25T01:45:35Z")
Hello,
There is one of the ways to calculate a vorticity vector:
1. Load foam1.csv \> **Table To Points** Filter (TableToPoints1)
2. In the same way, load foam2.csv \> **Table To Points** Filter (TableToPoints2)
3. Use the **Append Geometry** filter to merge TableToPoints1 and TableToPoints2 to a single point cloud.
4. Use the **Clean** filter to remove duplicate points.
5. Add the **Delaunay 3D** filter to turn a point cloud into a continuous volume.
6. Use the **Calculator** filter to create a velocity vector: iHat_U\_0+jHat_U\_1+kHat\*U\_2
7. Use The **Gradient Of Unstructured Data Set** filter to calculate vorticity from velocity vector.
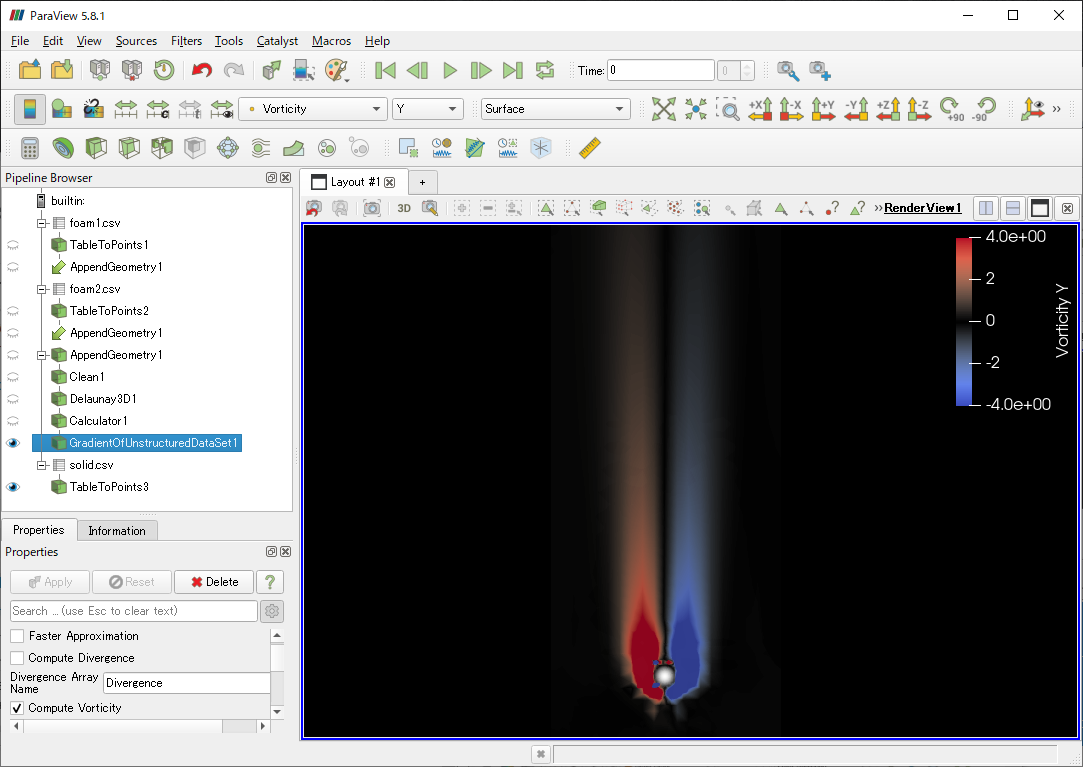
Here is a ParaView state file that replicates the above.
[vorticity.pvsm](https://discourse.paraview.org/uploads/short-url/gyA8UDhRukb9KZIE4szq1HUU5X9.pvsm) (1.1 MB)
---
### Author:  [@govind\_sharma](https://discourse.paraview.org/u/govind_sharma)
#### Post date: [September 25, 2020, 10:21am UTC](https://discourse.paraview.org/t/vorticity-contour-for-falling-sphere/5404/5 "2020-09-25T10:21:52Z")
Thanks Kyoshimi,
I tried what ever you stepped out . With same pvms file, I do not see vorticies but I can visualize other like u\_0, u\_2. I took screenshot just after loading in pvsm.
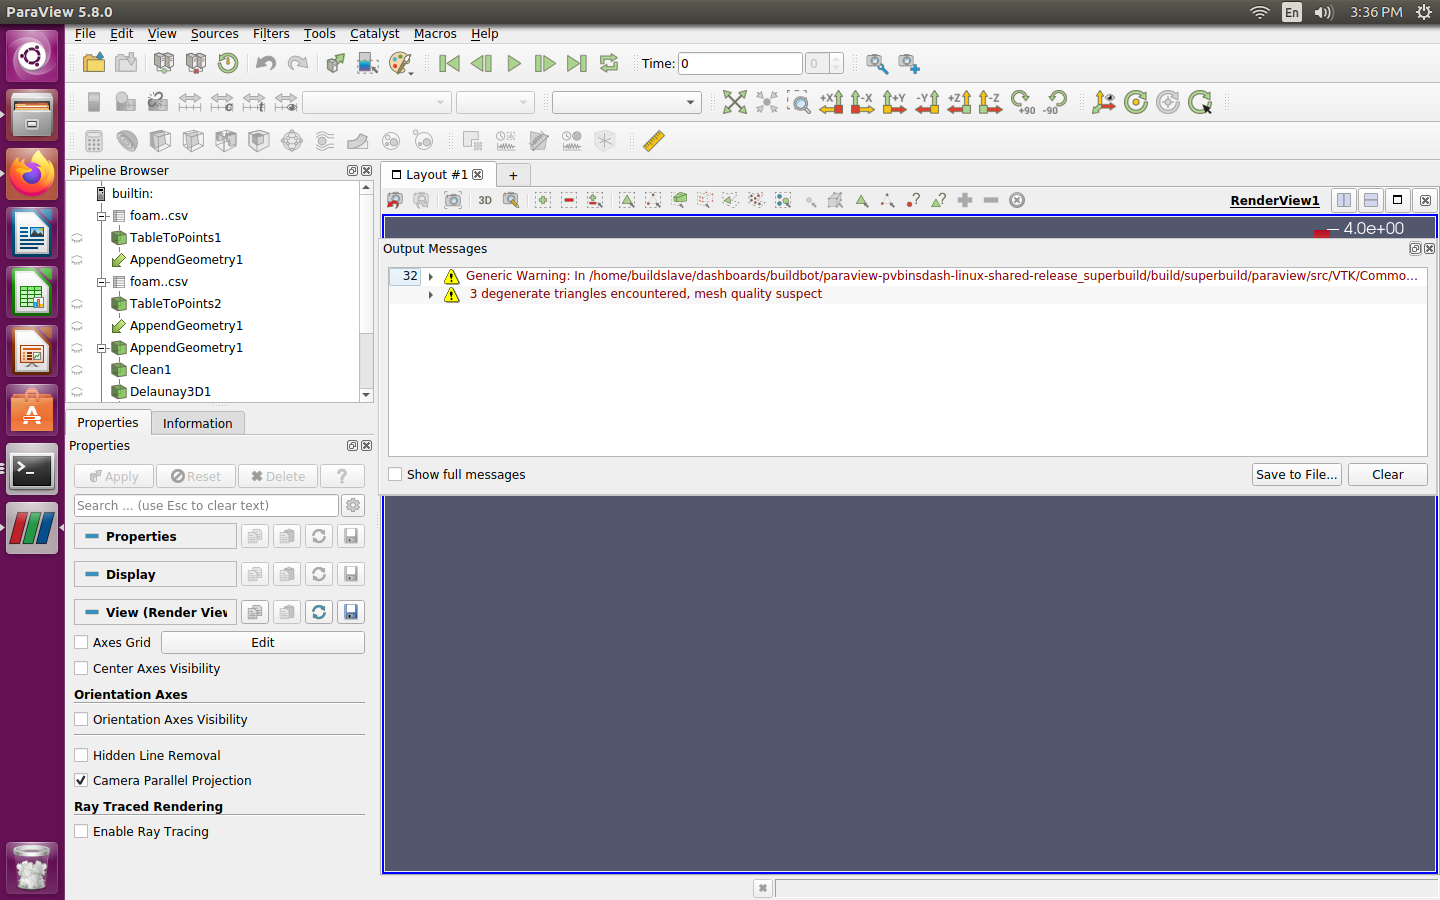
I followed myself to generate the visualization pipeline I get the error for filter “gradientOfUnstructureDataset”.
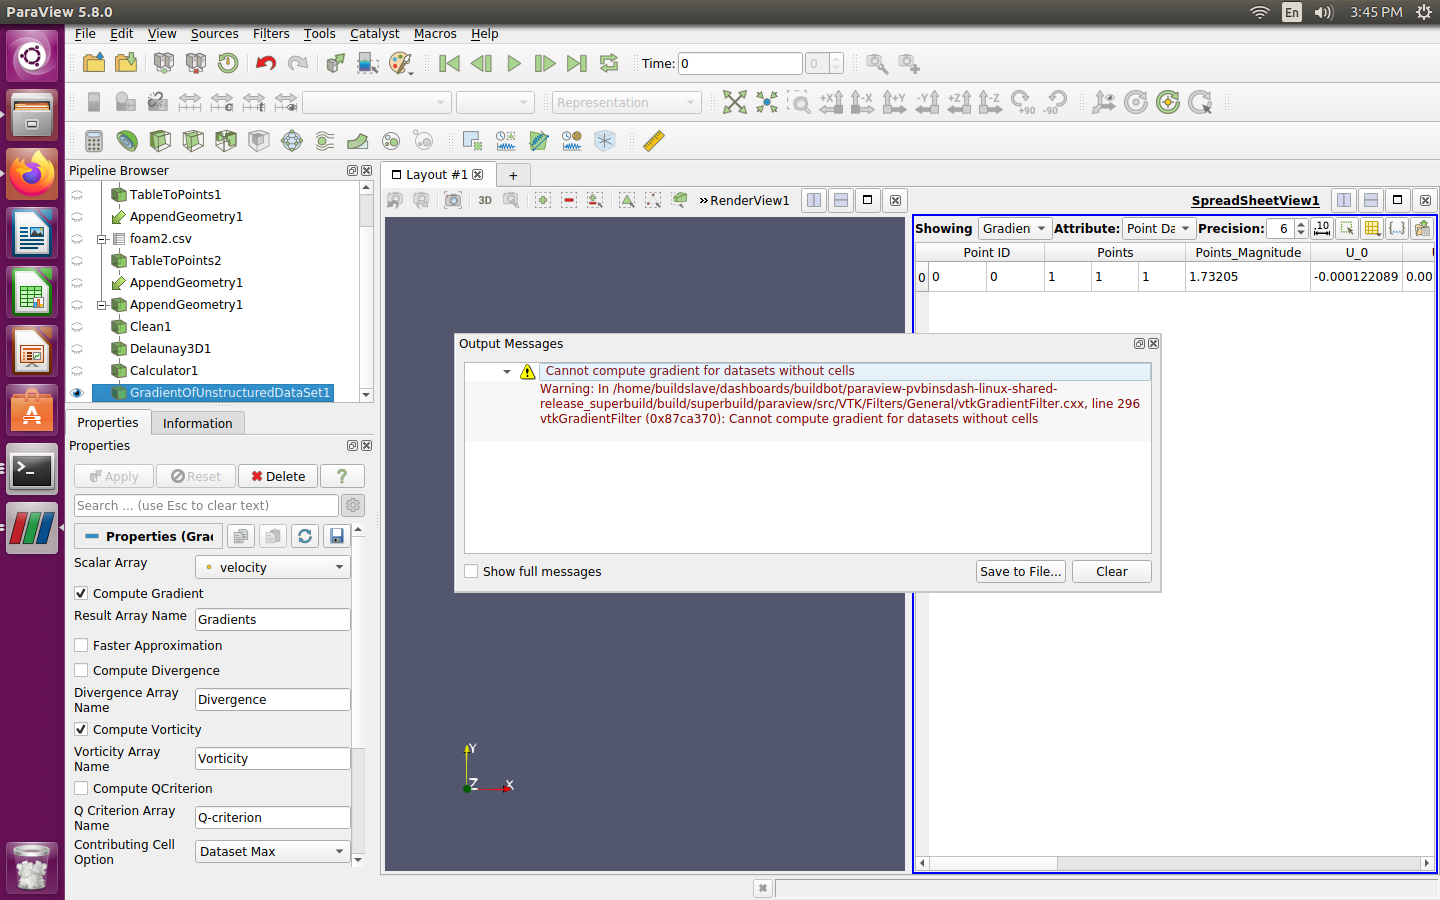
In this case I do not see anything.
---
### Author:  [@Kenichiro-Yoshimi](https://discourse.paraview.org/u/Kenichiro-Yoshimi)
#### Post date: [September 25, 2020, 11:29am UTC](https://discourse.paraview.org/t/vorticity-contour-for-falling-sphere/5404/6 "2020-09-25T11:29:48Z")
Hello,
In loading a pvsm, would you hit the eye icon on the left side of GradientOfUnstructuredDataSet1 in the pipeline browser?
---
### Author:  [@govind\_sharma](https://discourse.paraview.org/u/govind_sharma)
#### Post date: [September 25, 2020, 12:03pm UTC](https://discourse.paraview.org/t/vorticity-contour-for-falling-sphere/5404/7 "2020-09-25T12:03:49Z")
I got it with pvsm. Actually I did just refresh the dataset and I can see. But its not smooth one (may be because of grid size I will check that if its).
If I want to see line contours of vorticity then how do I do that?
And when I setup pipeline myself I get the error for filter i.e. second image above.
---
### Author:  [@Kenichiro-Yoshimi](https://discourse.paraview.org/u/Kenichiro-Yoshimi)
#### Post date: [September 28, 2020, 7:31am UTC](https://discourse.paraview.org/t/vorticity-contour-for-falling-sphere/5404/8 "2020-09-28T07:31:28Z")
Hello,
Some additional steps might be required to see contour lines:
1. Use the Calculator filter to extract y-component from a vorticity vector: Vorticity\_Y
2. Apply the Slice filter to cut a volume with a symmetry plane: Origin(0.625, 0.625, 5), Normal(0, 1, 0)
3. Use the Contour filter to to grab contours.

This is a state file:
[vorticity1.pvsm](https://discourse.paraview.org/uploads/short-url/wE01rZdfUaJk1KOrv5ND2r2gqQC.pvsm) (1.4 MB)
> And when I setup pipeline myself I get the error for filter i.e. second image above.
I’m afraid that I have no idea why the error occurs.