# What does this temperature curve mean via block dataset ?
**URL:** https://discourse.paraview.org/t/what-does-this-temperature-curve-mean-via-block-dataset/12226
**Category:** ParaView Support
**Created:** [June 3, 2023, 9:20pm UTC](https://discourse.paraview.org/t/what-does-this-temperature-curve-mean-via-block-dataset/12226 "2023-06-03T21:20:00Z")
**Posts on this page:** 2
**Page:** 1
### Author:  [@billexe](https://discourse.paraview.org/u/billexe)
#### Post date: [June 3, 2023, 9:20pm UTC](https://discourse.paraview.org/t/what-does-this-temperature-curve-mean-via-block-dataset/12226/1 "2023-06-03T21:20:00Z")
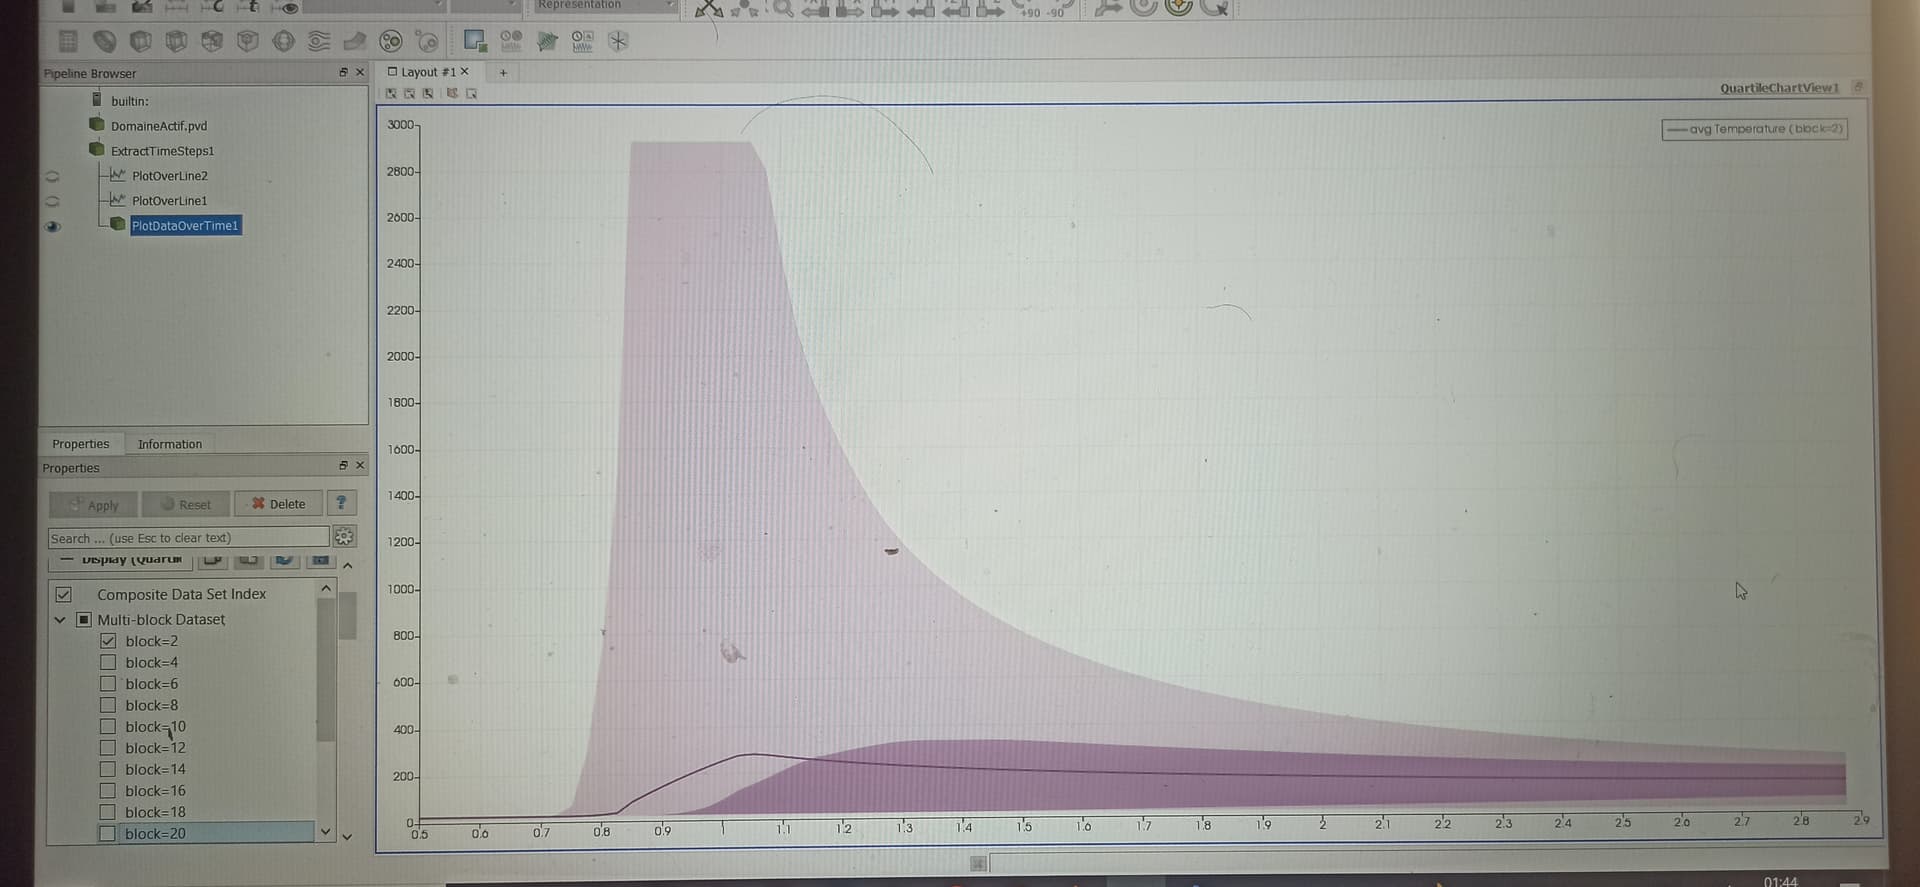
Hello everyone, what does this type of temperature graph mean, also what does the block dataset represent ?
Thanks 😃
---
### Author:  [@Kenneth\_Moreland](https://discourse.paraview.org/u/Kenneth_Moreland)
#### Post date: [June 4, 2023, 12:48am UTC](https://discourse.paraview.org/t/what-does-this-temperature-curve-mean-via-block-dataset/12226/2 "2023-06-04T00:48:48Z")
What you are seeing is a quartile chart. (Note the `QuartileChartView` label in the upper right.) When you ran the `PlotDataOverTime` filter, at each time point (x axis) you are considering all of the values of your data set at that time. This chart is showing a statistical summary of the data at each time step.
The dark line is showing the average value at each time step. The somewhat less darker region is showing the range where 50% of the values lie. The lighter region around that is showing the total envelope of all values. So, the light region above the darker region is showing the range of the upper 25% of values and the small light region below the darker region is showing the range of the lower 25% of values.