# WSS, Graph plotting
**URL:** https://discourse.paraview.org/t/wss-graph-plotting/10537
**Category:** ParaView Support
**Created:** [October 17, 2022, 1:56pm UTC](https://discourse.paraview.org/t/wss-graph-plotting/10537 "2022-10-17T13:56:46Z")
**Posts on this page:** 6
**Page:** 1
### Author:  [@Sumit\_Kumar](https://discourse.paraview.org/u/Sumit_Kumar)
#### Post date: [October 17, 2022, 1:56pm UTC](https://discourse.paraview.org/t/wss-graph-plotting/10537/1 "2022-10-17T13:56:47Z")
Hi all,
I did simulations on patient-specific models. I have calculated WSS, TAWSS, and OSI in the simulation file, but I want to plot graphs of WSS , TAWSS, and OSI on a wall in transient simulation case . Kindly help me with that.
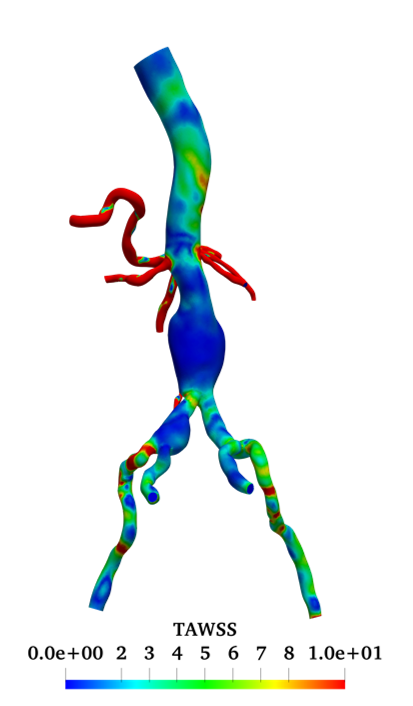
waiting for response
> Blockquote
---
### Author:  [@Kenichiro-Yoshimi](https://discourse.paraview.org/u/Kenichiro-Yoshimi)
#### Post date: [October 18, 2022, 12:21am UTC](https://discourse.paraview.org/t/wss-graph-plotting/10537/2 "2022-10-18T00:21:38Z")
Hello,
To graph time series data, the `Plot Data Over Time` filter or the `Plot Selection Over Time` filter may be used.
By the way, TAWSS and OSI are given by
\text{TAWSS} = \frac{1}{T}\int\_0^T |\tau\_w|dt
\text{OSI} = \frac{1}{2}\left( 1 - \frac{\frac{1}{T}|\int\_0^T \tau\_w \:dt|}{\frac{1}{T}\int\_0^T|\tau\_w| \:dt} \right)
where \tau\_w is the WSS vector and T is the duration of the pulsatile cycle. Therefore, since TAWSS and OSI are integral values in one heartbeat cycle and not time series data, can’t we draw a graph for each time step?
---
### Author:  [@Sumit\_Kumar](https://discourse.paraview.org/u/Sumit_Kumar)
#### Post date: [October 18, 2022, 5:06am UTC](https://discourse.paraview.org/t/wss-graph-plotting/10537/3 "2022-10-18T05:06:12Z")
Thanks for your reply but i am asking how to plot , like extract over 3d geometry in my case.
---
### Author:  [@Kenichiro-Yoshimi](https://discourse.paraview.org/u/Kenichiro-Yoshimi)
#### Post date: [October 18, 2022, 5:45am UTC](https://discourse.paraview.org/t/wss-graph-plotting/10537/4 "2022-10-18T05:45:39Z")
Hello,
I am not sure what kind of drawing you are wanting to do. Do you have an example of an image?
---
### Author:  [@Sumit\_Kumar](https://discourse.paraview.org/u/Sumit_Kumar)
#### Post date: [October 18, 2022, 6:24am UTC](https://discourse.paraview.org/t/wss-graph-plotting/10537/5 "2022-10-18T06:24:56Z")
Yes its there in question ,
Mai i have your email id ?
---
### Author:  [@uog](https://discourse.paraview.org/u/uog)
#### Post date: [August 13, 2024, 8:53am UTC](https://discourse.paraview.org/t/wss-graph-plotting/10537/6 "2024-08-13T08:53:53Z")
Hello Sumit Kumar,
Could you share the idea how to draw the TAWSS, and OSI on a wall? Are you draw it in simulation software or in paraview?