Hello Mary,
Regarding question #1:
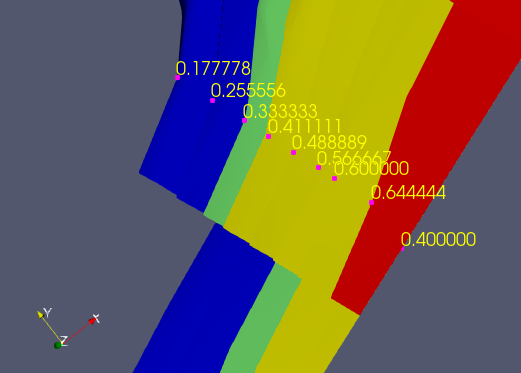
Is it possible to add labels to contour lines?
Example made based on that discussion (using Interactive Select Points On tool + Edit->Find Data):

Regarding question #2:
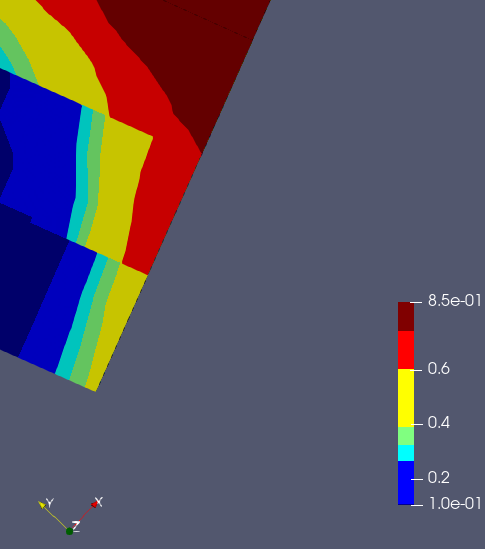
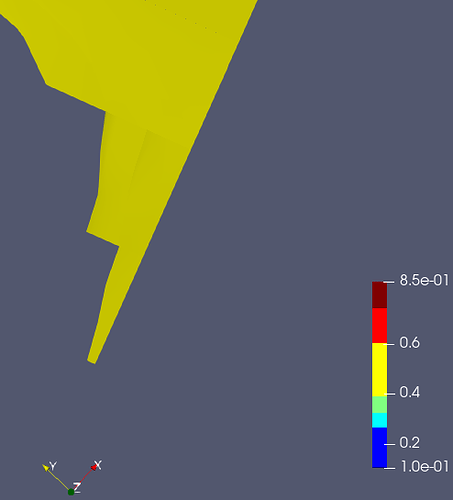
you could apply Countour filter with requested range of U magnitude values, then CellSize filter, and finally IntegrateVariables filter. In the Information panel you’ll see the area of interest. Example:
1.Model
2.Countour filter:
2A. Set range:

2B. View after filter applying:
3.CellSize filter - Area array (on Infromation tab):
![]()
4.IntegrateVafiables filter - Total area of region of interest (on Information tab):
![]()
You can also use Python Calculator filter for the last step.
Hope it helps.
Best Regards,
Pavel

