cory.quammen
October 5, 2023, 1:33am
21
It looks like the figures showing the glyph figures appear early in the text of the tutorial so that they appear to be associated to the Contour filter discussion, but they are not. If you follow along in section 2.1.4.4, you’ll be able to generate an image like in Figure 2.8.
maxning
October 5, 2023, 11:16pm
22
I went to 2.1.4.4, but the GUI is also different from the paraview I am using now.
I have opened the “file.foam” and clicked “apply”, is there anything I didn’t do?
mwestphal
October 6, 2023, 10:27am
23
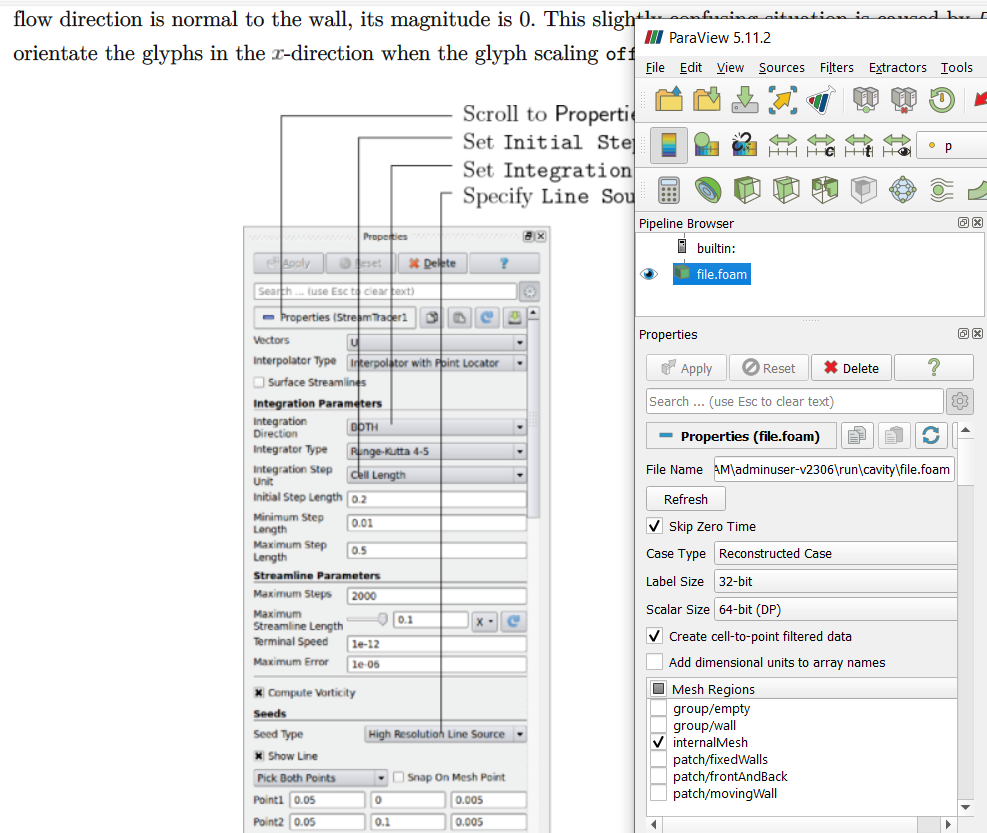
This is a screenshot of the StreamTracer filter.
You must have missed a step suggesting to add a StreamTracer.
maxning
October 25, 2023, 9:53pm
24
I did not see stream tracer filter in previous steps in the tutorial…
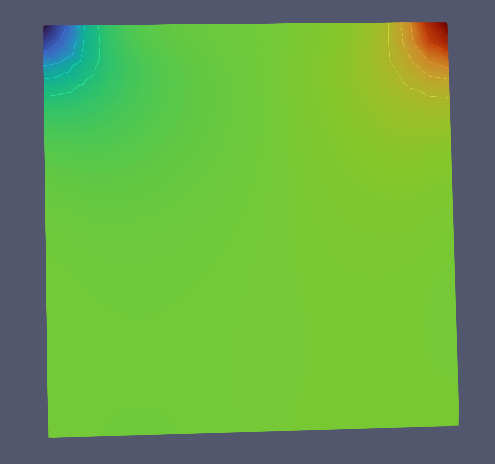
Also, I managed to do the “contour” as per the tutorial, but it looks like this:
I don’t think this is right, but I don’t understand what I do wrong:
mwestphal
October 26, 2023, 1:00pm
25
You may want to ask the person who wrote the tutorial
maxning
October 26, 2023, 3:13pm
26
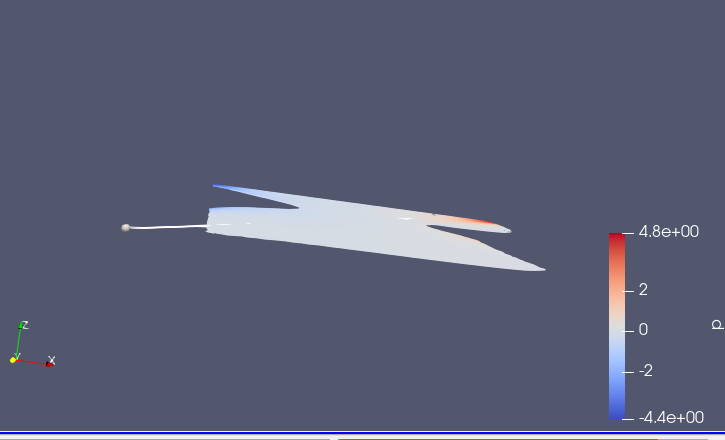
I managed to find the stream tracer filter, but it only have options for speed U and not pressure P. And when I click apply, this is the result:
From the sides:
That can’t be right, right?
mwestphal
October 26, 2023, 3:21pm
27
Pressure P is a scalar, not a vector. You can only streamtrace vectors.
maxning
October 28, 2023, 11:14pm
28
Got it.
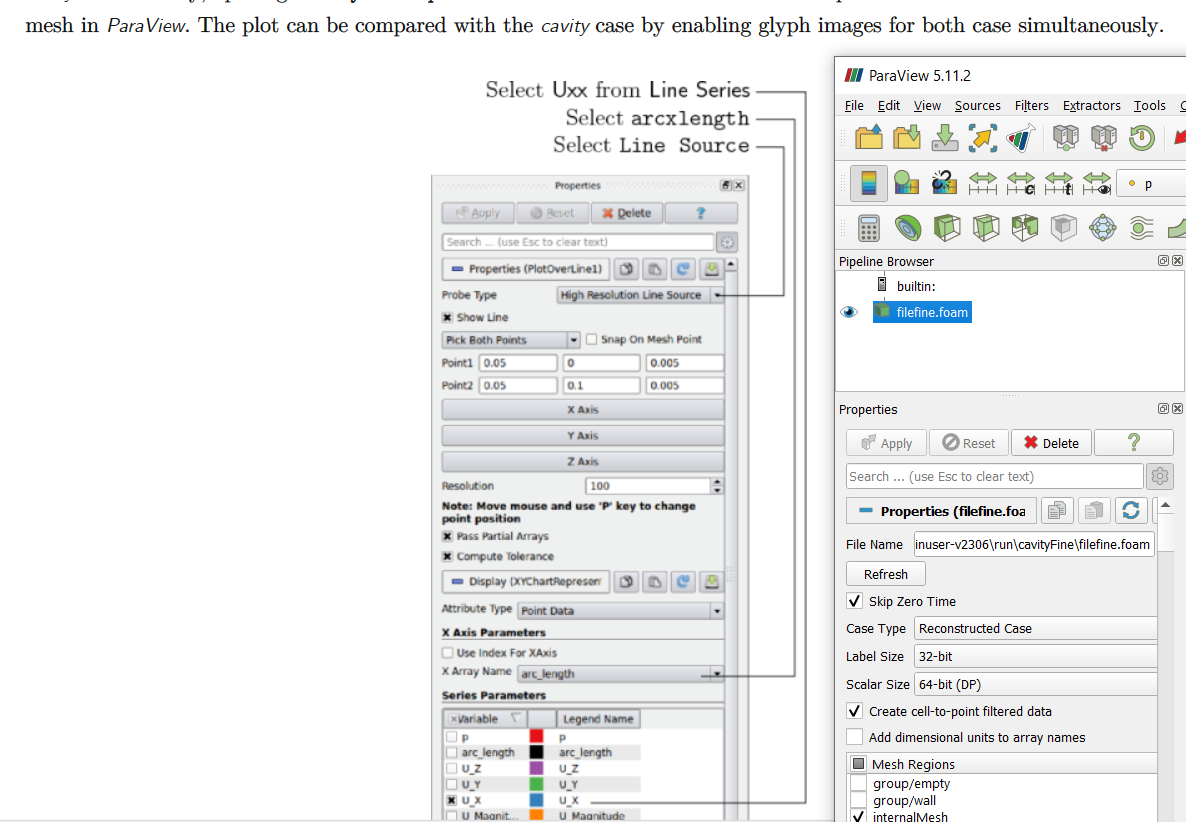
I am now working on the part where it says to “create a vector plot of the results”:
But I don’t see the same GUI setup, even though I already clicked Apply and refresh many times. Could you tell me why?
mwestphal
October 30, 2023, 8:26am
29
Please ask this tutorial creator.
Plot
Probably open a LineChartView.