Thank you for your support. This gives me only chosen value (DX displacement over timestep) What I need is force - displacement curve (F - DX), but values of F and DX depend on timestep, load and displacement changes over timestep.
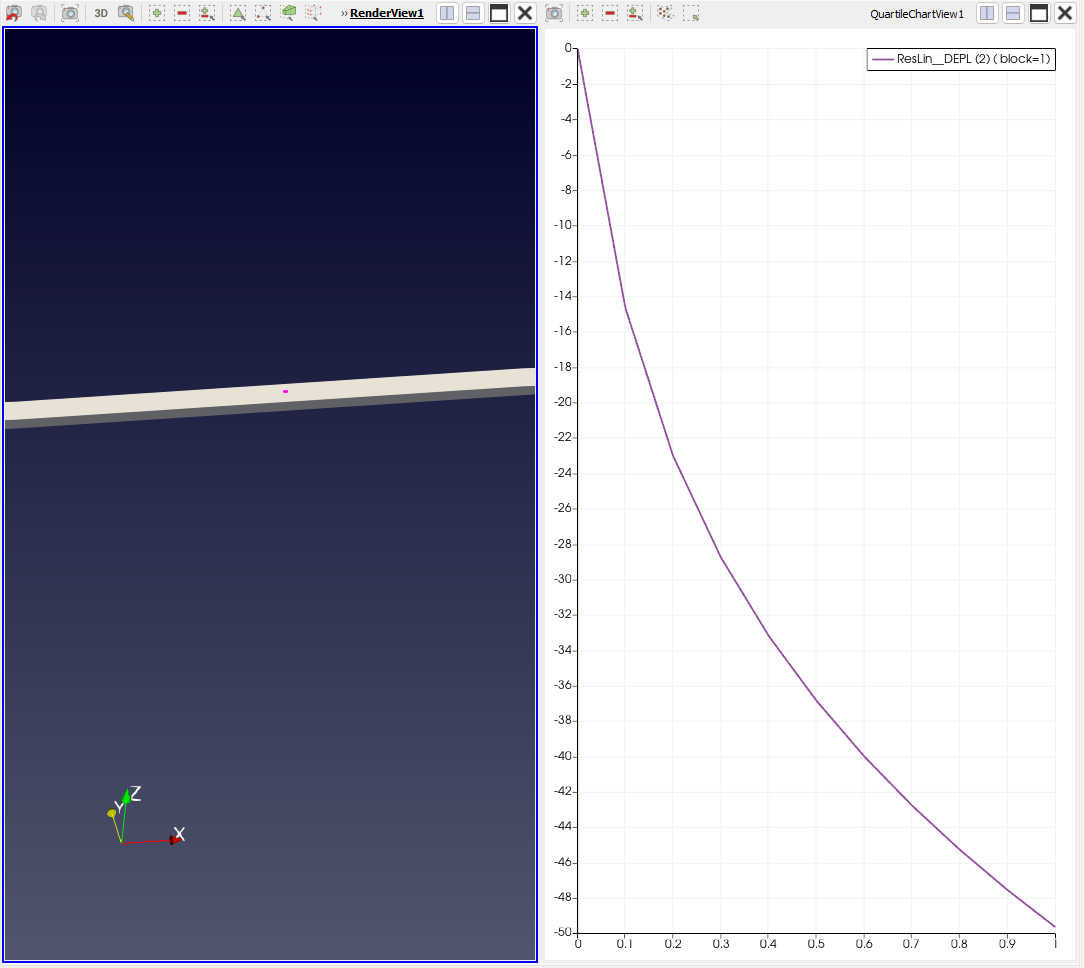
This is what I get when i plot selection over time:
And this is what I want to plot:
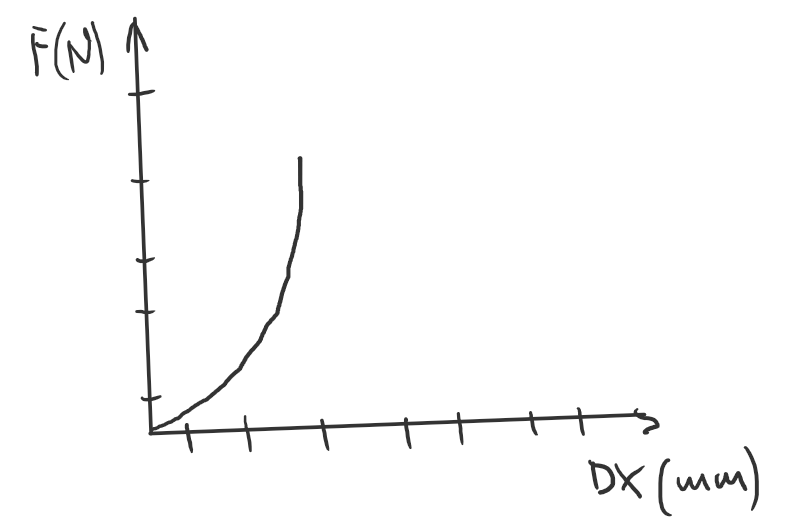
How I imagine it should be done is to sum forces applied to selected nodes to have a total load and put it in one column (like in Excel), where every cell is sum from time step. Then in second column I’d have to put chosen displacement according to time step as well. Then If I have those two columns, I could plot them in form of simple curve. I know how to do it in Excel manually, but I believe this trivial task can be easily tackled by such powerful postprocessor as Paraview. I just don’t know where to click.