Numerics of "Gradient Of Unstructured DataSet" Filter

Yes, the gradient computation within the cell only considers those points incident on that cell. A tetrahedron, which is a simplex, has a completely linear interpolation and so the gradient, which is the same everywhere in the tetrahedron, is essentially the slope of the scalar in that space.

Like I said, the gradients in adjacent tetrahedra will be different and thus will be averaged along the points.

Does this remain the same/very similar for the “Gradient” filter? I have the option to generate a structured grid. With either method, do you know of a way to dictate how many elements along the surface normal-vector should be used for calculating the gradient at the wall/boundary?

With the unstructured method, I’m now looking at using the “Point Dataset Interpolator” filter to bring the gradients you discussed onto the surface. If I could sample along the normal, this might work as well. It appears that I can only choose from a radius or total amount of nearest-neighbors.

No, the Gradient filter, which uses vtkImageGradient, does a significantly different computation than Gradient of Unstructured Grid. This filter uses finite differences to estimate the gradient. For each point, it takes the difference of the neighbors in the X direction for the X component of the gradient, and likewise for the Y and Z directions.

That’s really good to know… Is there a way to create a structured grid from my currently unstructured mesh with ParaView? I’d like to stay within the interface; however, if not, what form of imported geometry would you recommend?

The “Table To Structured Grid” doesn’t appear to be working very well. Although, I haven’t spent more than a day whittling away at it. The finite difference method should solve my issue.

The easiest way to create a structured grid from an unstructured mesh (with volumetric elements like tetrahedra) is to use the Resample to Image filter.

You mention using Table to Structured Grid. That sounds like maybe your data is actually points stored in something like a csv file. If that is the case, you might try the Table To Points filter and then the Gaussian Resampling filter.

I’ve been working on getting the structured grid and applying the Gradient filter once my Resample To Image is generated. However, I’m having issues getting Gradient to work. When I import my CFD results, I have:

  • Point Data: contains point 3D space orientation, velocity vector, velocity-component array(s) [x, y, z]
  • Cell Data: Block Number, Cell ID, Cell Type (Tetrahedron)

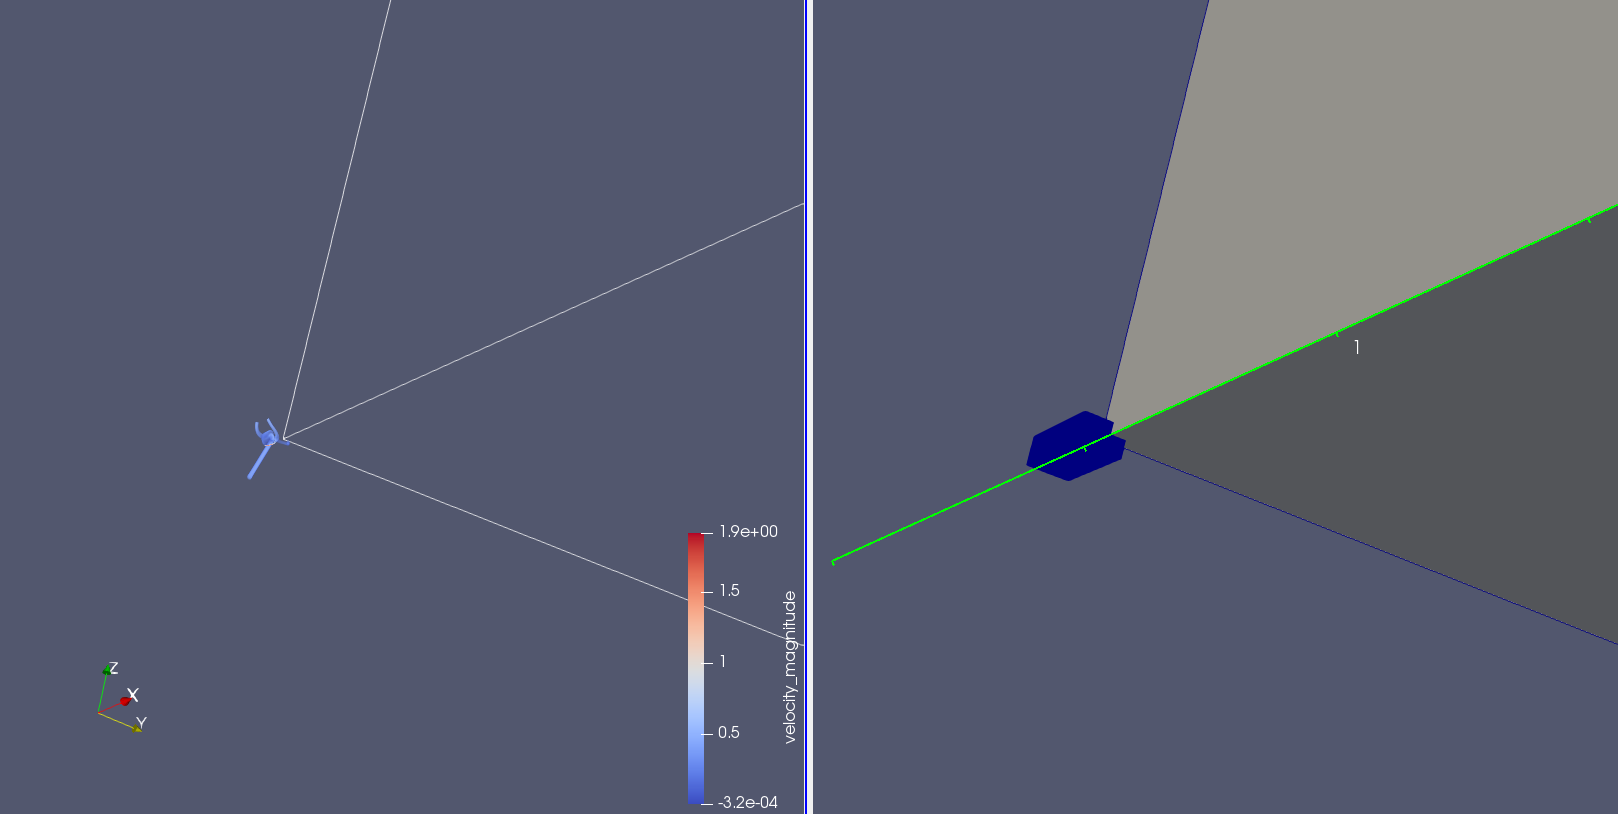
I can create the structured grid, and the vectors/scalars are transferred over well. I’m able to visualize nicely with the “Volume” rendering. I use Transform to scale the data back to the correct scale (m → mm) before creating the structured grid. I am able to apply Gradient to either version of the structured grid, but I’m having errors.

For the case where I’ve transformed > grid generation, I get:

No Scalar Field has been specified - assuming 1 component!

Which is strange, because I am feeding it a scalar. When applying to the NON-transformed grid, I don’t receive any errors. However, the bounds of the gradient-dataset are stretched/do not stay at the same location or scale. The top two images show the structured grid/shape of my volume render. The bottom two show how Gradient caused a massive expansion.

These both sound like bugs. I’ve raised bug reports for both of them.

https://gitlab.kitware.com/paraview/paraview/issues/18496
https://gitlab.kitware.com/paraview/paraview/issues/18497

I think you can ignore error messages that you are getting. The Gradients still seem to be computed.

I don’t have a simple workaround for the rescaling of the data. You could use the transformation controls under the display parameters to rescale and move the data to where it is supposed to be.

Hi Kenneth and Jmuskat,
I’m stack on a similar issue and hope you can help me!
As J, I want to compute Wss from velocity data. My raw data is a little bit different though. I have a volume of velocities (x,y,z) and an .stl file which defines the region of interest I want to study. The geometry is an aorta model. The velocity data came from mri data and the stl from a segmentation of the aorta from images.
This is what I did: GradientOfUnstructuredData of the velocity field to get the velocity tensor–> resample it over the .stl model–> extracted surface normals from the stl geometry.
I would like to ask you:

  1. if what I did so far is correct
  2. How would you compute the WSS having the 9 components of the tensor and the 3 components of the normal to the surface?

This was my idea:
WSS_x= viscosity* (t1n_x + t2n_y + t3n_z);
WSS_y= viscosity
(t4n_x + t5n_y + t6n_z);
WSS_y= viscosity
(t7n_x + t8n_y + t9*n_z);
and then compute the magnitude
Thanks a lot!

So far what you describe (compute gradients on volume then resample on stl) is how I would recommend doing it.

For the second part, can you run a second computation after resampling on the stl data? If the stl data does not directly have the normals, you can run the Generate Surface Normals to create it. You can then use the Python Calculator to compute the WSS.

Hi Kenneth,
Thanks for your help! I found out the way to do it :slight_smile:

Hi Kenneth,
I was trying to validate the wss computation from paraview with results from cfd simulation.
Input in paraview=velocity field from cfd and then I computed gradients etc…
I realized that comparing du/dx (from cfd) and Gradient0 (from paraview) are different (one order less). And of course the wss it’s different too…Do you have any idea why this is happening?
Thanks a lot!

1 Like

I’m not sure what the issue is. This question started with a scaling problem. Could the issue be that the CFD code and ParaView are computing the gradient with different scales of dx?

I’ve checked the scales of both velocity and size of the grid and they are both in meters (in paraview). Do you think that remeshing the velocity field in paraview could change something? My idea so far is that the computation of the derivatives in paraview is done by finite difference while fluent could work on finite volumes so probably is more accurate. Do you think is more correct computing the gradient on cell data or point data? Because also changing from point to cell the results are completely different…
Thanks a lot!

1 Like

Hello

Sorry to get into the thread. But I want to compare measured velocity fields from medical imaging and velocity fields from CFX as a result of a CFD simulation. What formats did you use to export your velocity field from CFD? Was it in ANSYS or is it a custom code format.

Thanks

I’m facing a similar problem. I developed a pipeline to calculate the wall shear stress from 4D Flow MRI data. To validate my pipeline I loaded a Computational Fluid Dynamic simulation I did on Ansys fluent (Tetahedral volumetric mesh) and I applied the “Gradient of Unstructured DataSet” Filter on the velocity vector obtained from the CFD simulation to compute the stress tensor. Nevertheless, the wss estimate I obtain is an order of magnitude lower than that obtained from Ansys. I computed the Vorticity using the filter and compared it with that from the CFD simulation and the value seems to be half that computed on Ansys. I’m pretty sure all the units are ok. Any help is more than welcomed!

Hi Xabier, I went trough the same streamwork as you (4d flow-cfd-paraview) and found the same results. I think the problem is in how the partial derivatives are computed. Let me know if you find a solution, I m curios to see what we can do with paraview :slight_smile:

1 Like

Hi all,

I struggled with this for 2 weeks tried to calculate WSS using Paraview. In the end it was not working due to the limitations in Paraview and it was not possible to calculate the slope near the wall with a predefined filter.

So, I decided to make a script in Python. Luckily the new PyVista library have some nice functionalities for 3D objects, mesh, and surfaces. You can find an example code on my github page.
Feel free to contribute and leave any comments.
https://github.com/EdwardFerdian/wss_mri_calculator

Hi Edward!
I’ve just read your pre-print, 4DFlowNet, very interesting work congratulations. I’m personally working with 4D flow in the left atria and super-resolution could be of great help to fully characterize the complex hemodynamics inside this heart cavity.

In regards to the WSS calculation, I was waiting for the people from Ansys to answer how they specifically calculate in the Fluent solver but I still haven’t received any response from them. I’m familiar with PyVista so I will definitely give a try to your code. I will let you know how it goes.
Thanks for your help!

Hi Kenneth and Chiara,

I also stuck on calculating WSS from velocity field in paraview.

I have a 3D flow over cylinder case in openfaom, and I want to derive the WSS around cylinder, which is a no-slip wall. Here are my steps in paraview:

(1) use Filter (Calculator): calculate mag(U) for all mesh grids
(2) use Filter (Gradients of Unstructured Dataset): generate grad(U) for all mesh grids
(3) use Filter (Calculator): calculate shear stress tau = mu * grad(U) for all mesh grids

Up to now, I have the shear stress tau for all mesh grids. And the next step is to obtain the shear stress for cylinder wall.

(4) use Filter (Extract Block) to extract cylinder
(5) use Filter (Extract surface) to extract cylinder surface

Here mistakes appear. The values for U, mag(U), grad(U), tau are all zero because the no-slip wall has zero velocity. Although it seems that I find the reason but I don’t know how to solve it. In order to calculate the WSS, maybe I need to extract the first layer mesh cells around cylinder instead of cylinder surface itself, but I don’t know how to do it in Paraview…

I would be very appreciated if you could give me some help! Thanks!

Hi Kenneth,

I need to calculate the iso-counters of the vorticity norm and compare it with reference data. There are 2 ways to do that; 1- computing vorticity norm inside ParaView using the velocity field obtained from the CFD code (with Gradient Of Unstructured DataSet Filter) or 2- calculating the vorticity inside the CFD code using the velocity field by applying a second-order approximation to calculate the partial derivatives.

The ParaView shows somehow a better job as the iso-contours of vorticity are close to the reference results. However, the iso-contours obtained from the CFD code show additional (spurious) structures.

I suspect that the approximation to compute the partial derivatives inside the CFD code (which is a second-order approximation) is not as accurate as what is computed in ParaView. Could you please explain how the derivatives (gradients) are calculated within ParaView?
My test case has uniform structured cells.

Best Regards,