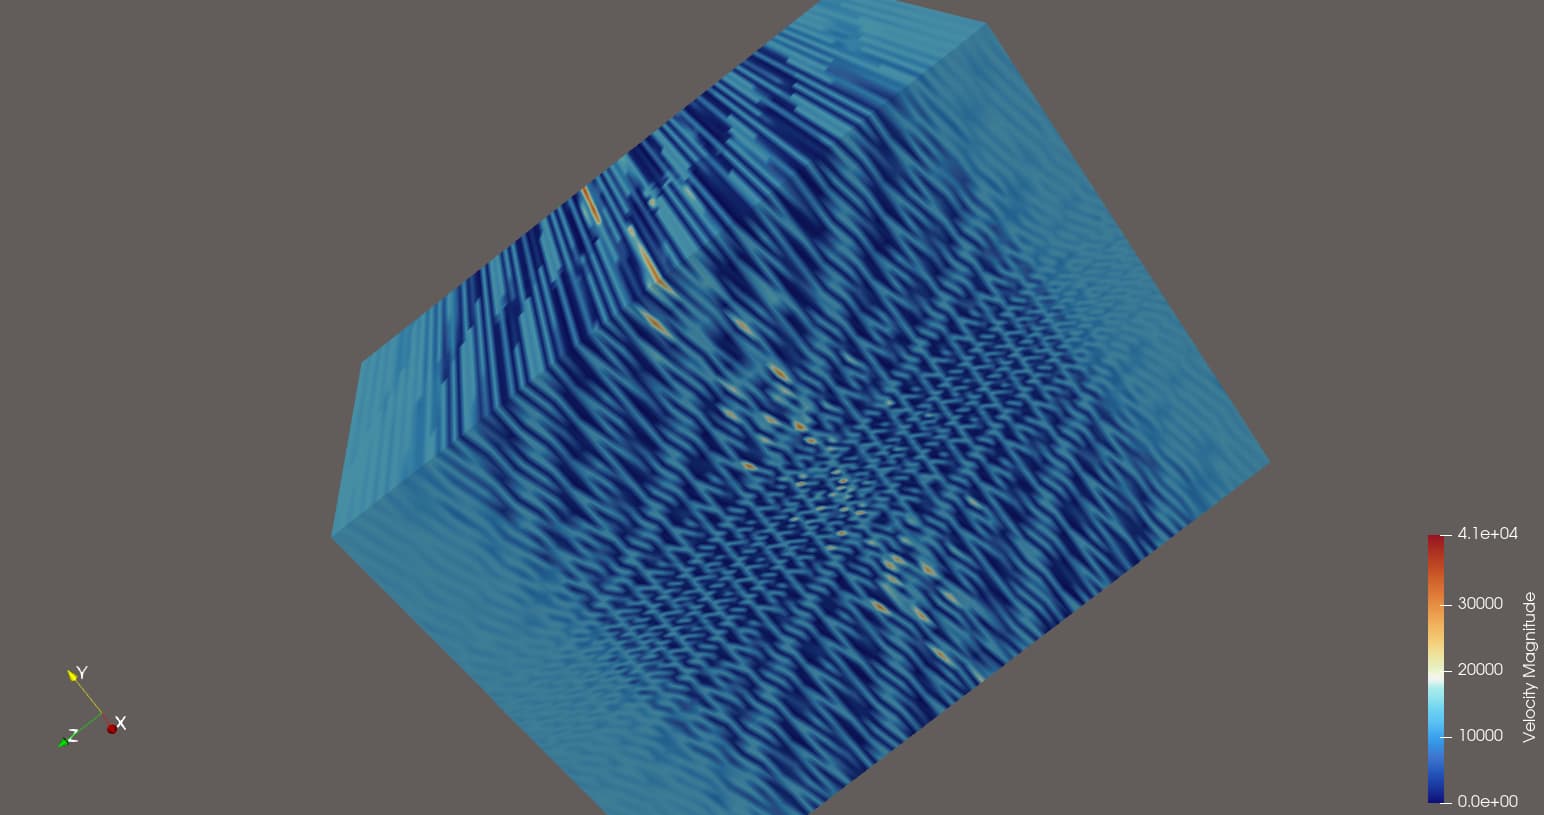
Are you sure your velocity field is correct ?
It doesnt look right here:
Thank you Mathieu for getting back.
Here is how I generate those velocity timestamp files.
The dataset I received is in a special customized format, I used the specialized reader to get all the floats.
vx, vy, vz are the velocity[x,y,z] data file paths, all with the same grid[x,y,z].
e.g. grids info, gx, gy, gz size could be 8, 4, 4; then dataX,Y,Z size could be same that is 8x4x4=64; dims = [4, 4, 8]
x,y,z coordinates I played around for awhile, could you please take a glance, if anything looks suspicious to you? or the writer has some issue?
        dataX, gx, gy, gz = JRReader(vx)
        dataY, gx, gy, gz = JRReader(vy)
        dataZ, gx, gy, gz = JRReader(vz)
        velocity = np.column_stack((dataZ, dataY, dataX))
        writeVelociyVTK(dims, velocity, gz, gy, gx) # dims = [4, 4, 8]
Here is the writer function,
def writeVelociyVTK(fileName, dims, velocity, gx, gy, gz):
    grid = vtk.vtkStructuredGrid()
    grid.SetDimensions(dims)

    # Create a vtkPoints object to hold the points (the regular grid of points)
    points = vtk.vtkPoints()

    # Fill points with coordinates (this assumes a regular grid)
    for z in range(dims[2]):
        for y in range(dims[1]):
            for x in range(dims[0]):
                points.InsertNextPoint(gx[x], gy[y], gz[z])

    # Set the points to the grid
    grid.SetPoints(points)

    # Create a vtkFloatArray for the velocity vectors
    velocity_array = vtk.vtkFloatArray()
    velocity_array.SetNumberOfComponents(3)  # 3 components for velocity (vx, vy, vz)
    velocity_array.SetName("Velocity")

    # Fill the velocity array with data
    for i in range(velocity.shape[0]):
        velocity_array.InsertNextTuple3(velocity[i, 0], velocity[i, 1], velocity[i, 2])

    # Add the velocity array to the grid
    grid.GetPointData().AddArray(velocity_array)

    # Write the grid to a VTK file
    writer = vtk.vtkStructuredGridWriter()
    writer.SetFileName(fileName)
    writer.SetInputData(grid)
    writer.Write()
I did not analyse in details but with the image I see, I think you must be exchanging two axis in your generation of structured data.
ok, that’s what I suspected too, let me try to figure the axis issue.
meanwhile, as a reference, could you help post your previous dataset again?
the “canExEx.e” dataset? Tons of thanks!
https://drive.google.com/file/d/14p8noWVdlS2ixSRwc0rcOUJ-2F9xijBn/view?usp=sharing
then I can see the video that I am targeting for at least.
Im afraid this dataset is lost, but you can use the particle tracer on any temporal volumic file like here: particle tracer - disappearing after time step 1 - #3 by Nikolas_Kare
Thank you, yea that Youtube tutorial I watched many times and I also downloaded the tutorial sample dataset, however, whenever I specify the input to the seed for particle tracer or stream tracer, paraview crashes. I installed latest PV5.13.3 on Mac Intel.
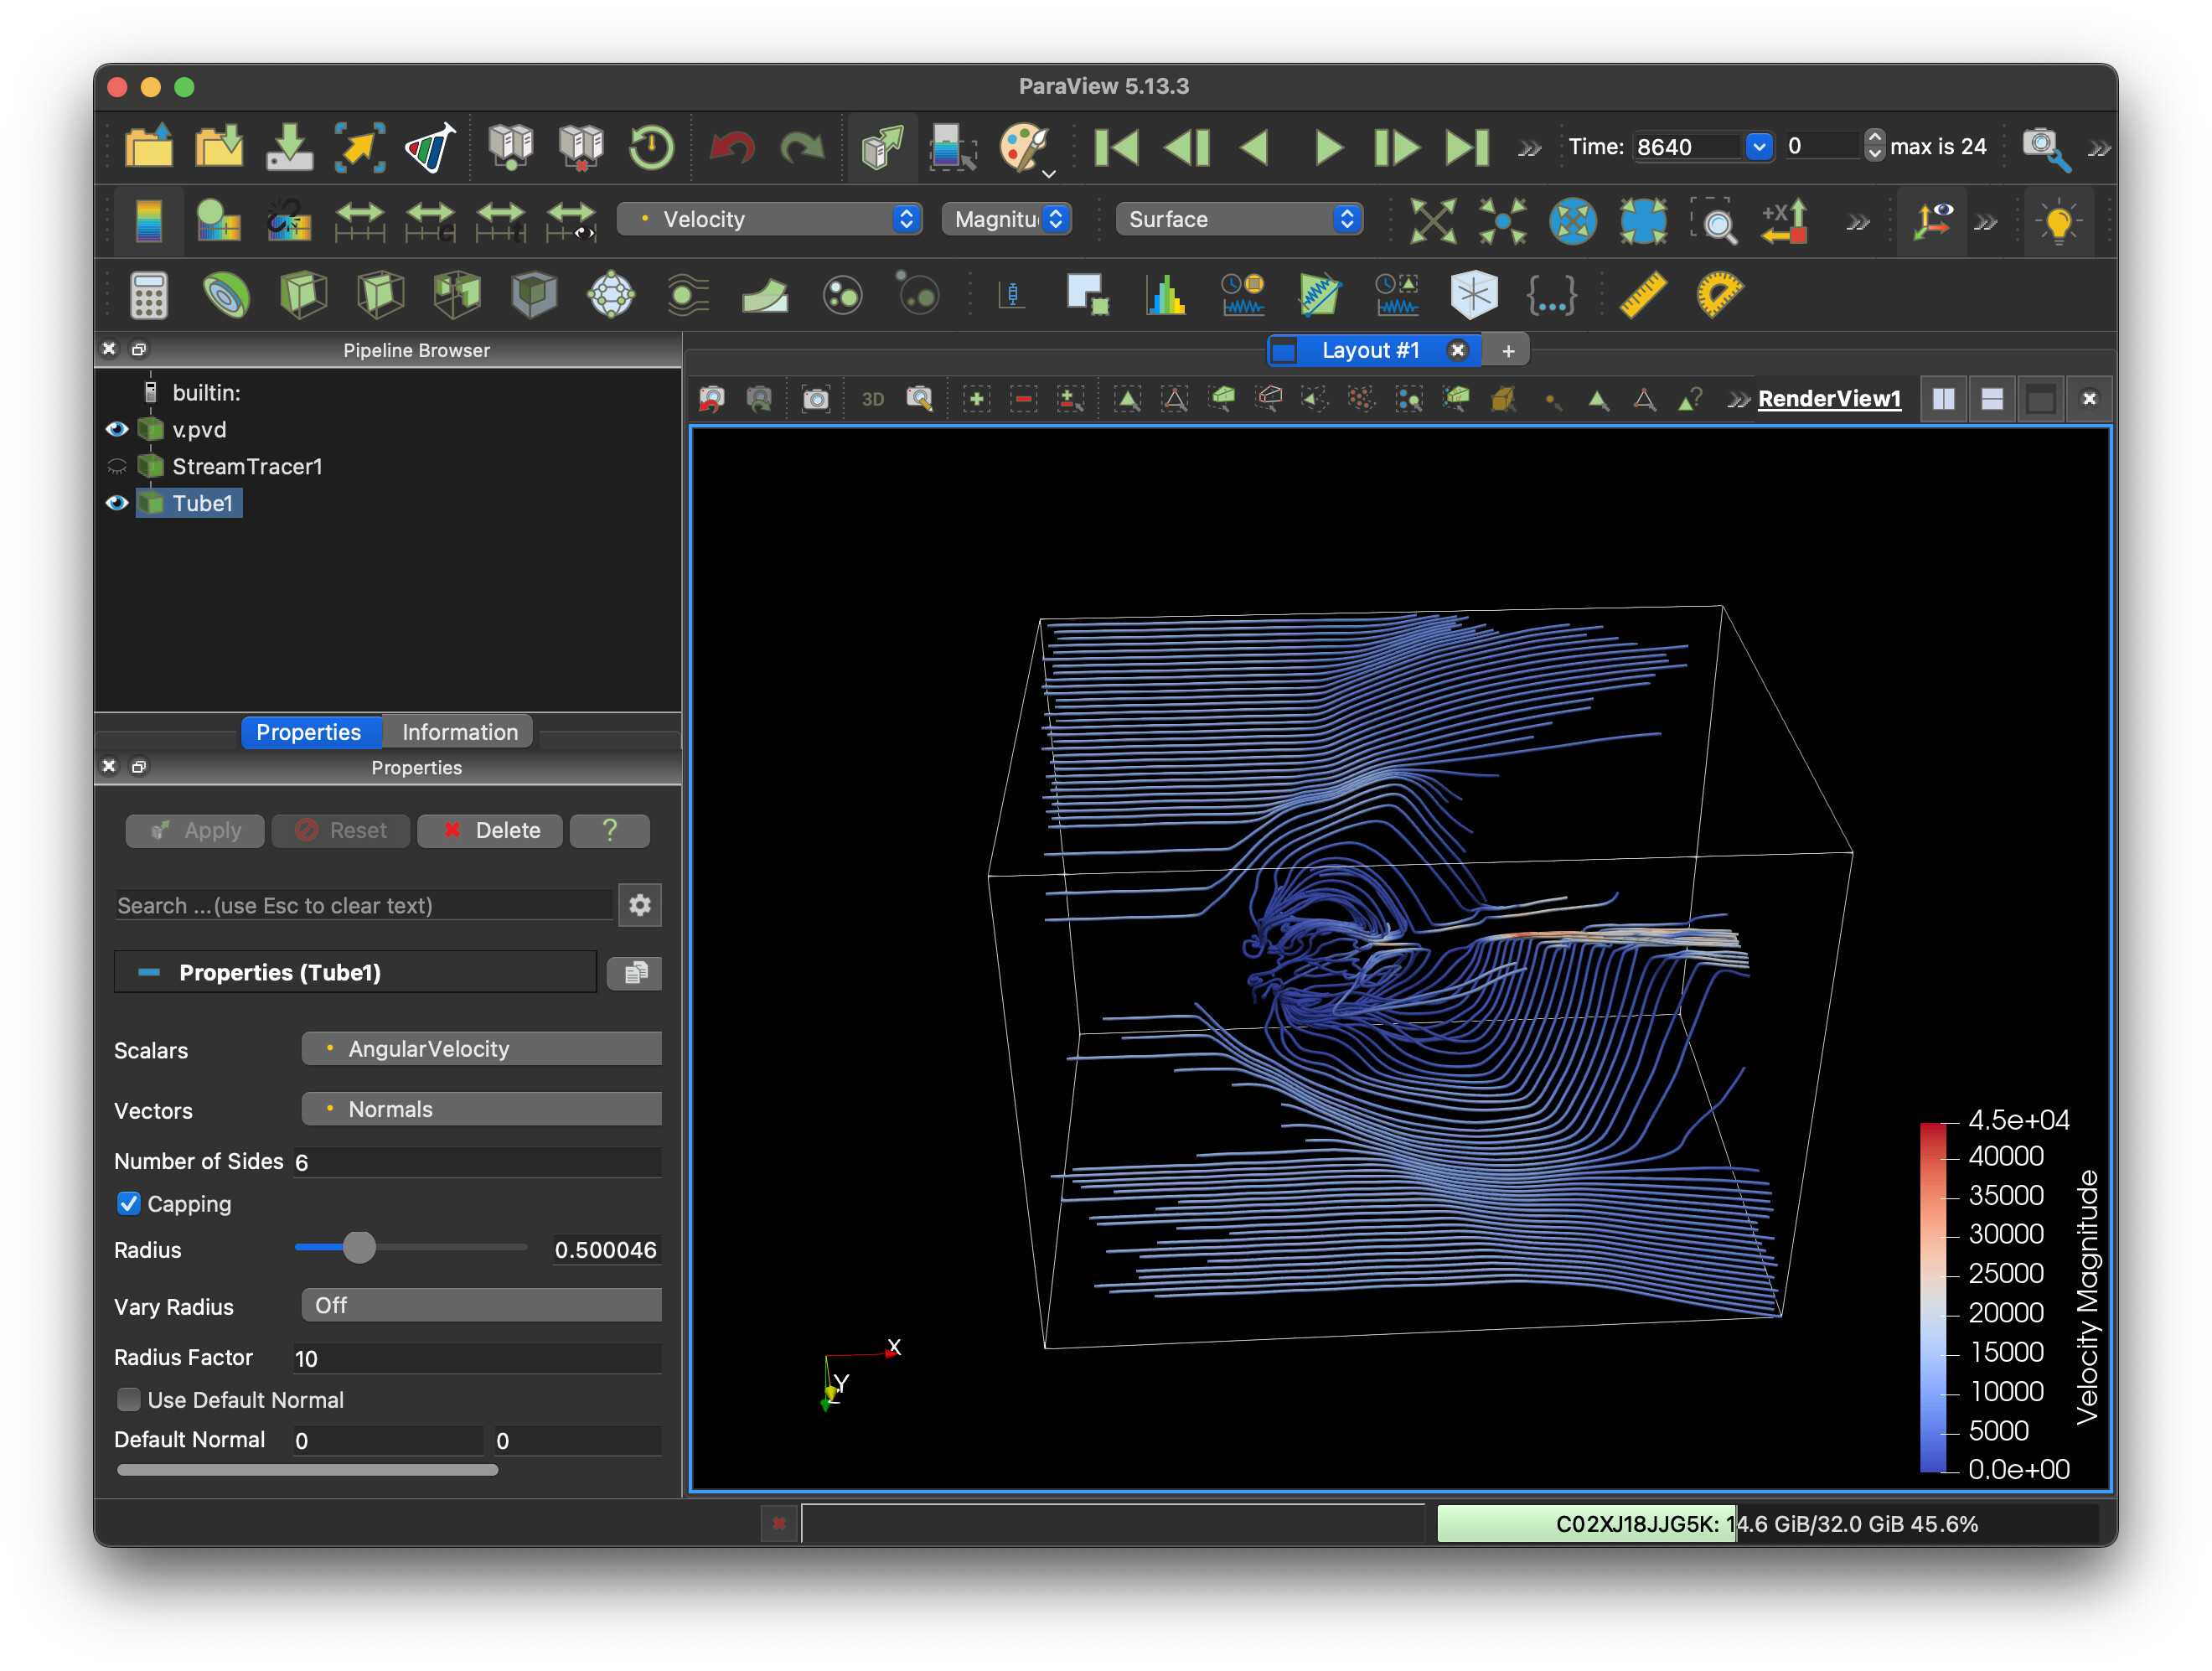
Anyways, thank you for pointing out, my generated vtk datasets axises did have issues, as they are written in Fortran, which is really confusing. But now I am able to view streamline of the velocity now. Here is the newly generated datasets
But as I mentioned earlier do you know why whenever I want to see particle tracer, ParaView crashes 100%? Does it work for you?
There was a bug in ParaView 5.13 that have been fixed already. You may want to use the nightly:
https://www.paraview.org/download/?version=nightly
Sweet, the newer version looks great in default lighting and color!
And I am able to see other people’s particle trace now.
However for my dataset, it’s point vector temporal data, but I still cannot see any particles.
Here is my state file, does it look right to you?
particleTracer.pvsm (714.0 KB)
You need to divide your velocity by a factor to avoid particles going out of domain on the first timestep.
Here is an example state file:
particle.pvsm (883.7 KB)
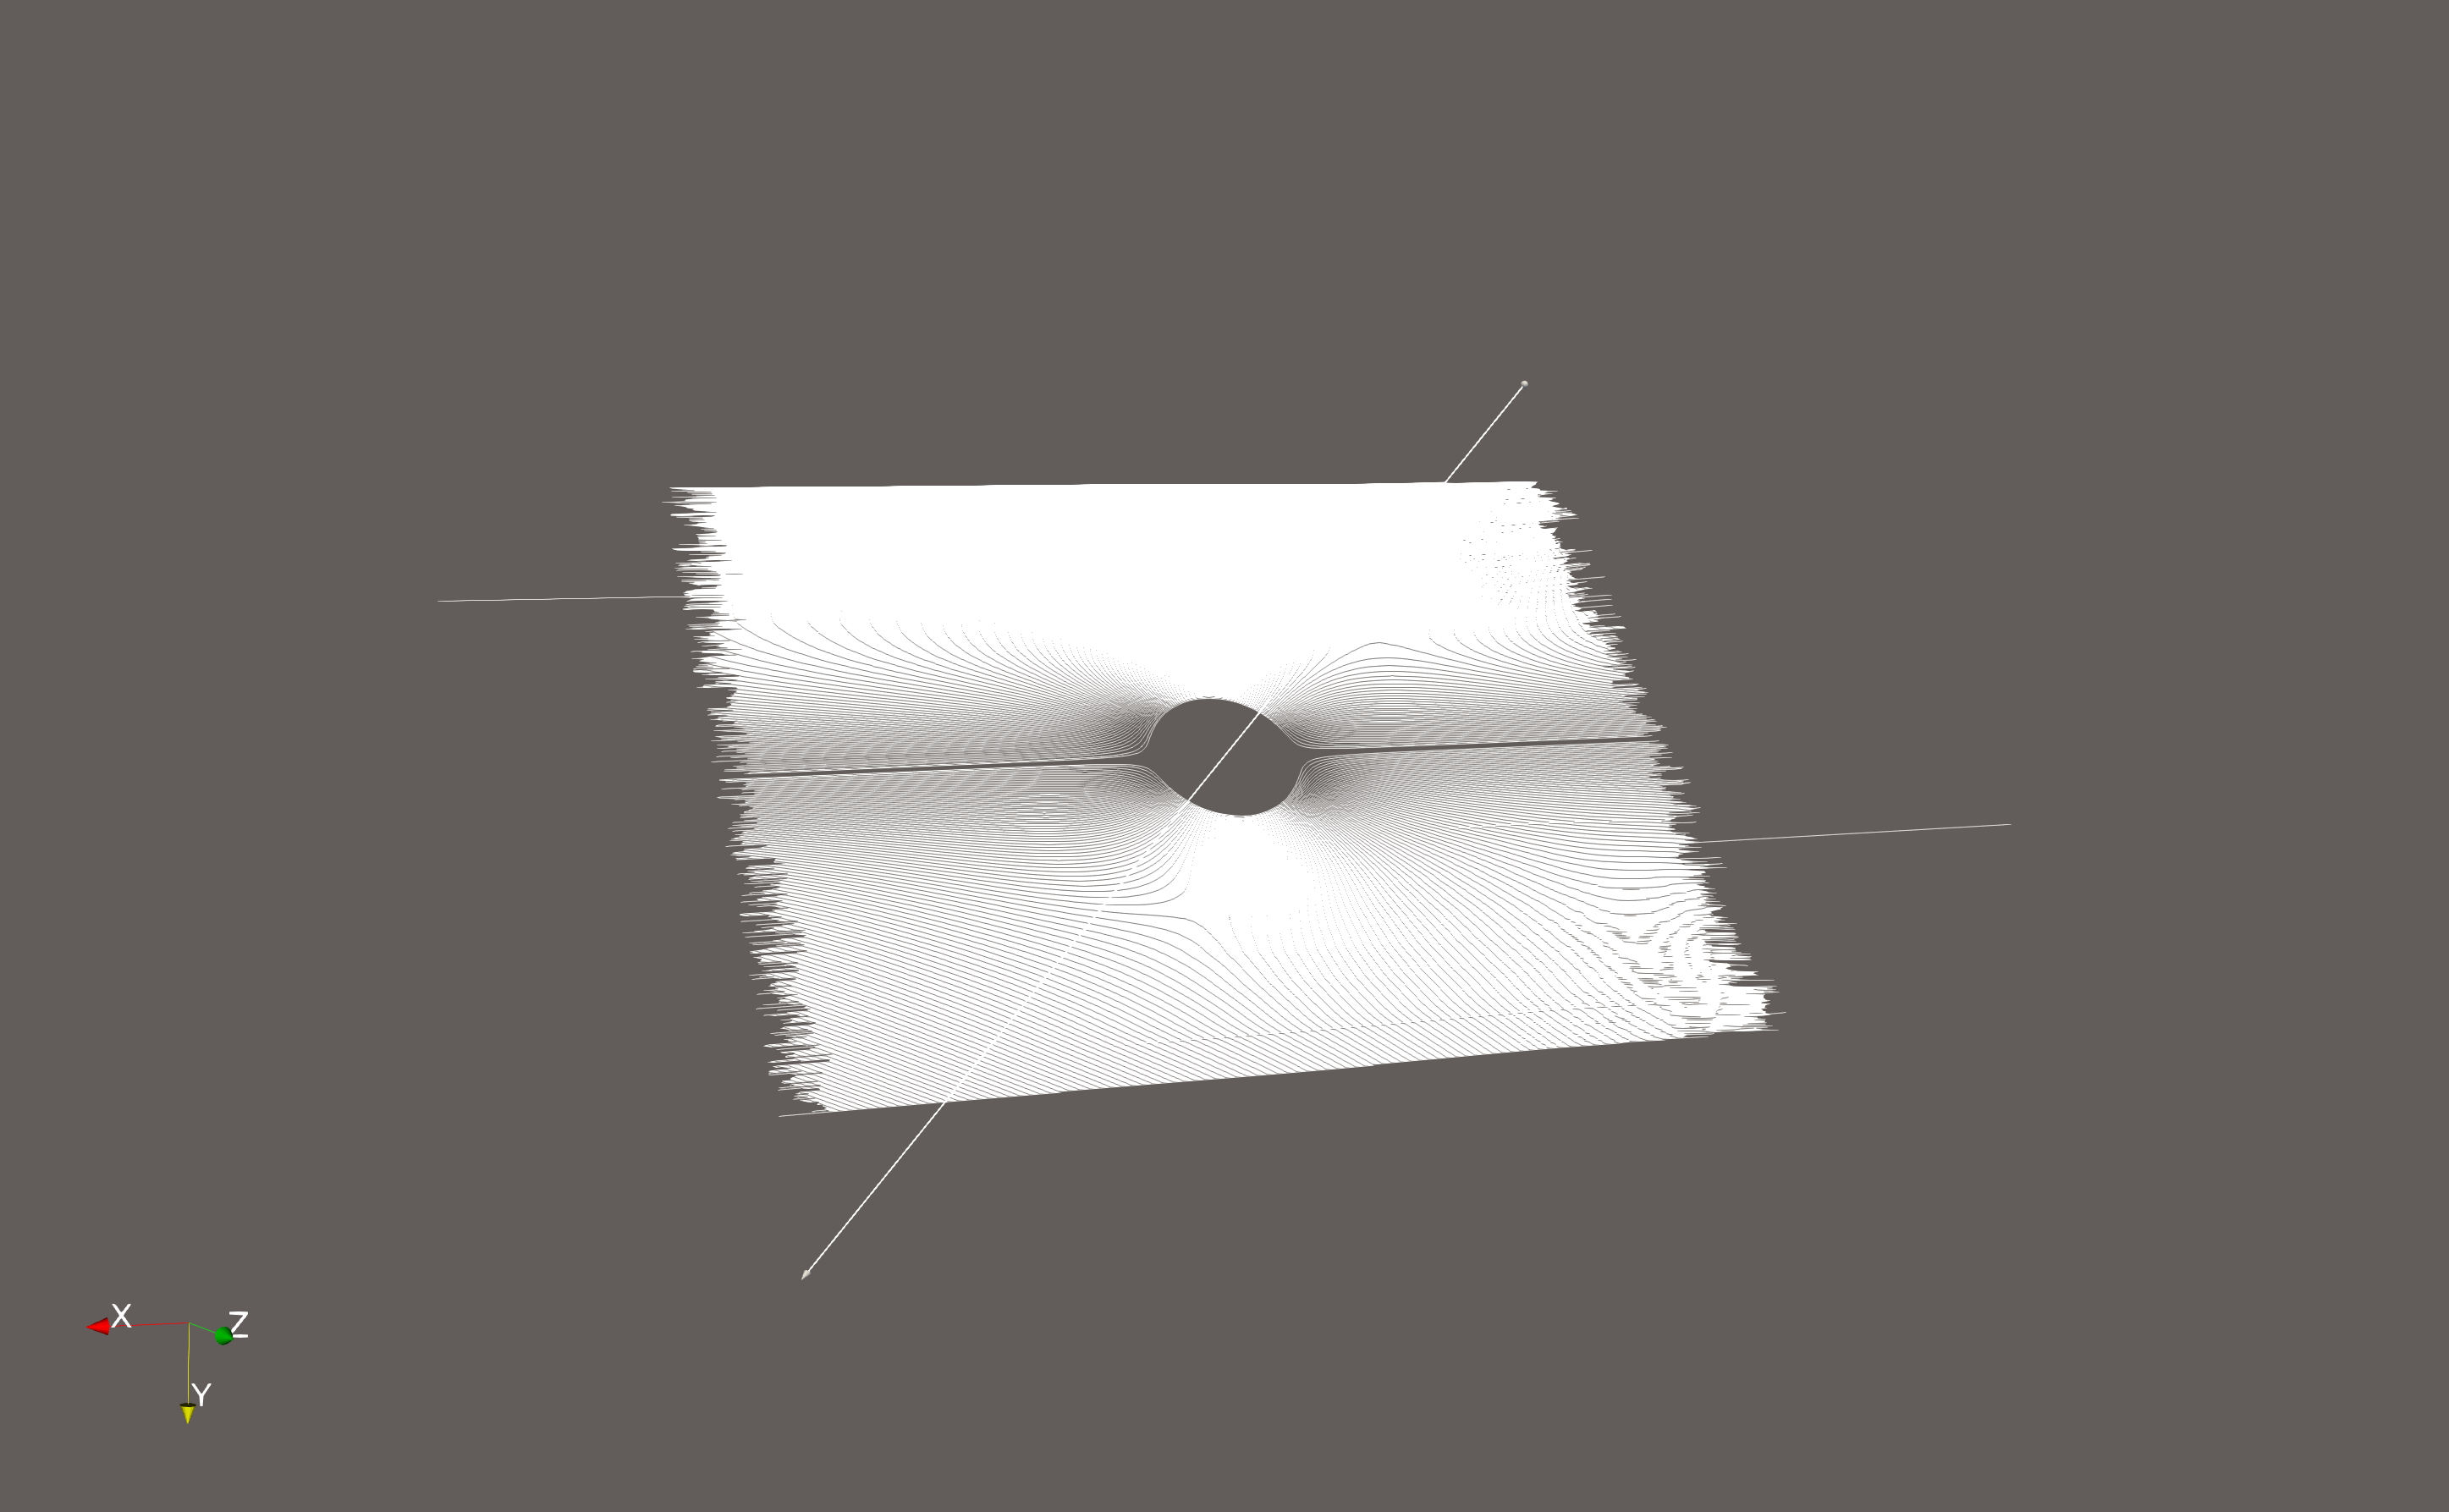
Great, good to know! Finally I am able to see particles!!!
Now I understand as the point source is within a domain. Such the factor is required, in calculation - Velocity/100000.
Thanks a lot for helping out! And no give up!
Best,
Can
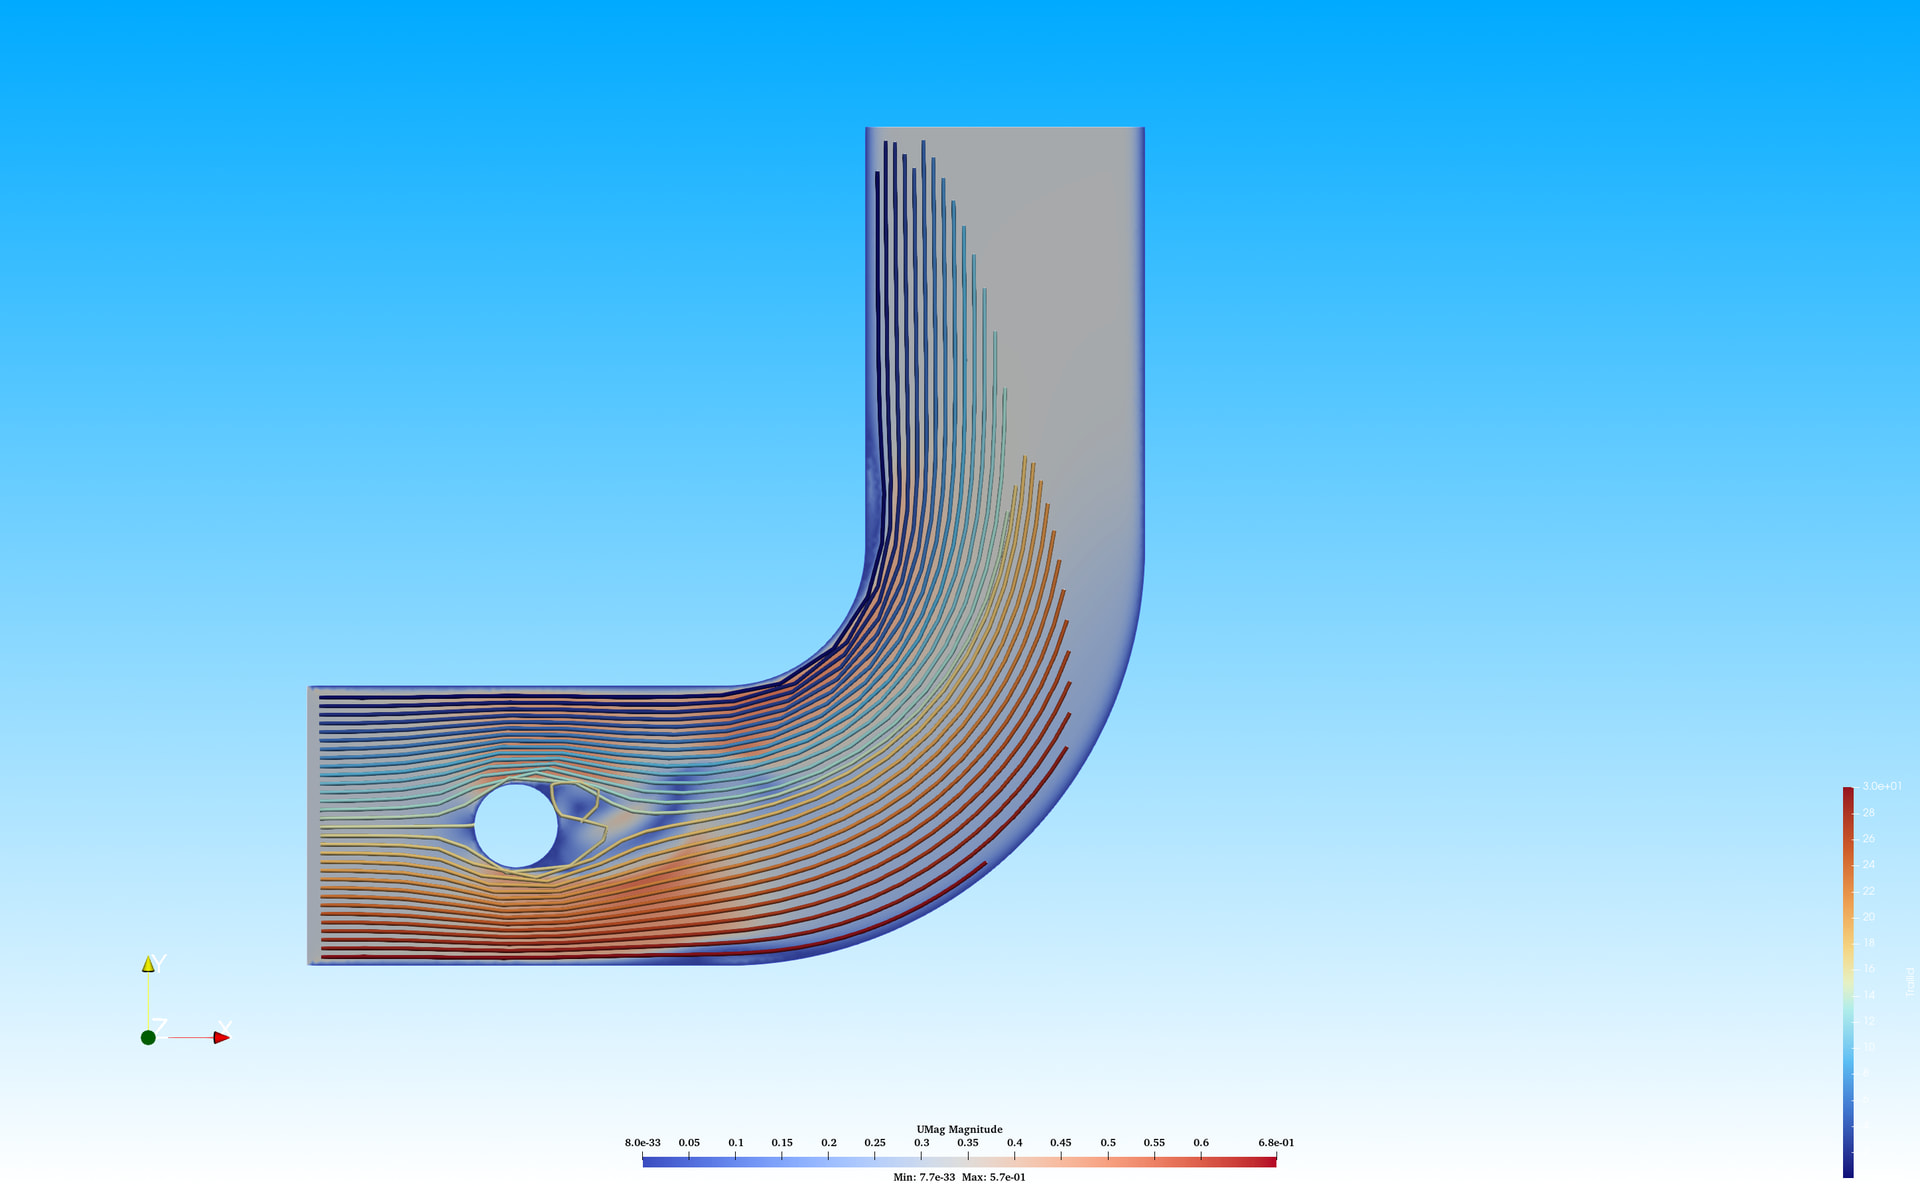
It is strange that 6.0.0 seems to have the same problem, I can get result using pv-5.7.0 but could not in 6.0.0. Using the data of `fluid_flow_convection.zip` of Youtuber [tuxriders](https://www.youtube.com/watch?v=Zmf8OE2N518).
And I can get result in 6.0.0 with 5.7.0 export state, load in 6.0.0
please share your data
In the google drive link below, the name is “fluid_flow_convection.zip“. I use both pv5.7.0 and pv 6.0.0 on windows.
tuxriders_postprocessing - Google Drive
sorry for the misleading, it is actually the particle tracer’s problem. The pvsm file using pv 5.7.0 is below(*pv570.mvsm). The paraview-6.0.0 should work by loading this pvsm, but could not directly reproduce the particle tracer using data. Also the problem is in paraview-5.13.1(*pv513.pvsm)
20201212_pv513_pTrace.pvsm (532.4 KB)
20201212_pv570_pTrace.pvsm (891.2 KB)
wow! Thank you dear Mathieu! I will switch to the new version