Visualizing sliced scalar field in moving frame of reference

Hi everyone,

I am tackling a rather thorny visualization issue.
I have an object moving in a 3D box with periodic boundary conditions and I want to visualize fields around that object as it reaches its steady state (constant velocity of the object).

Ideally, I could visualize and extract the fields over a slice centered on the object, which follows it at each timestep. The slice should contain the centre and the orientation vector of the object, which change over time.

(One more orientational degree of freedom is required to define the normal vector of the slice. I can set this angle manually for now).

I figured out how to change slice parameters from a Python script and how access row input data to create the appropriate slice at a given time, using the orientation and centre of the object.

Here’s where I need some help:

  • I don’t know how to turn this into a proper visualization that will move the slice over time.
  • Because of PBC the object can leave the box on one side and enter in the opposite side. When that happens the slice is cropped. Ideally I would want the object to remain at the centre of the slice, and the fields around it to account for PBC…

I can share my datasets and visualization efforts if needed.
Any help would be appreciated.

Jérémie

use the Animation View.

Indeed, share some screenshots and data to go further.

1 Like

Below you’ll find a tar file containing a subset of my simulation files. Included is a visualization template called visual.pvsm, I’m not sure if those are readable from your computer… If they are, you will have to change all iteration of the string “YOUR_PATH” to your working directory path.

my_files.tar.gz (2.7 MB)

If you use vim, something like :%s/YOUR_PATH/path\/to\/your\/working\/directory/g should work.

If you cannot read them, let me know and I will detail how to make the visualization… it’s not very optimal since my ouput files are part csv, part vtk. I should probably convert the csv’s into vtk’s.

Once you are able to load the visualization template, you should see something like this:

On the right are the two important datasets, converted from col-cds00* and dircol-cds00* “TableToPoints1” and “TableToPoints2”

  • TableToPoints1 contains the position and velocities of all the points (I call them particles) which form the spherical structure as well as one point in its center (this whole thing behaves like a membrane in my simulations).
  • TableToPoints2 contains the position of the centre particle, the orientation of the structure and an angle alpha which is not relevant here. I created an Arrow Glyph to visualize the orientation.
  • The sliced scalar quantity phi-00* is a field of concentration which evolves over time.

If you start the animation you can see the object moving. Since I included a small number of spaced-out files the motion is erratic but that does not really matter here.

What I want to do is visualize the phi-00* fields in the frame of reference of the object, which can be defined by stating that in that frame, the particle in the centre of the spherical structure has a null velocity. These planes would cut the structure in half (contain the centre particle) as well as contain the orientation vector m of the structure. There will be one additional degree of freedom to rotate the plane around that orientation vector, which I can set manually.

The way I see it there are 2 major issues:

  • How to create the slices
  • How to animate the slices

Regarding how to create the slices, I don’t know.
Regarding animating, I have looked in the Animation View and although I see that I can access Slice parameters from there I don’t see how I can change their values to time-dependant quantities of my dataset…

So you want your slice to be configured by your data ?
This is not really doable in ParaView without using some custom programmable filter.
You could also try using a LineGlyph + LinearExtrusion + ResampleWithDataSet, but this is a bit of a workaround.

I’m not enterely sure why you would need slices like that though, maybe I’m misunderstanding something.

That’s what I was asking yes.

I have tried your suggestion and ends up with something like this

This doesn’t look like a slice of the phi field, maybe there is some distortion that has been applied to it ?

What I really want is to extract the angular distribution of fields around the moving sphere. I thought the simplest way to do that was to extract slices in the frame of reference of the sphere, I would then have a series of images where the sphere is in the middle and the scalar field evolves around it until it reaches steady-state, like those aerodynamic simulation of a car that stays still while the air flows move around it.

Maybe this is not the best way to go about it, I could also try to project phi onto a shell type of Glyph, which would be centered on my moving sphere and with a slightly larger radius. Then I could extract it and do angular analysis.

For both solutions there is still the problem of having to duplicate the system on every side to account for periodicity…

At this point I’d recommand implementing this slice yourself in a C++ or python filter.

Ok. Can this be done from within paraview ?

Or would it be better to pass the series of slice to paraview ?

Yes, with a programmable filter. in Python.

Ok thanks I will try that.

Regarding the issue with periodic boundary conditions, when extracting slices, is there a simple way to duplicate the systems on all sides or to solve this problem in another way ?

Not sure of what you mean.

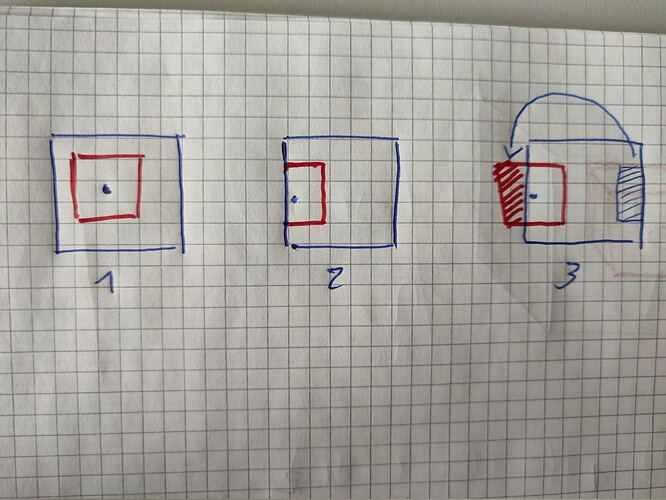
Instead of slicing imagine I extract the field from a box centered on my object.

If object is in the middle cf image 1 it works fine, but if object is near border cf image 2 the box is cropped.

Because my system has periodic boundary conditions, the full box can be reconstructed from the other side of the box cf image 3. This is equivalent to duplicating the system (the box) and copying it on all sides.

I am wondering if Paraview has such such feature but it seems from an older thread (Tile filter for data with periodic boundary conditions - #3 by woodscn) that it does not
There is no easy solution for that, you need to implement it manually.

You would basically need “periodic” datasets, which is not something that exists in VTK (yet).

OK thanks

I got pinged when you linked my thread, so I thought I would chime in.

Is your object moving at constant (or otherwise known) velocity? It should be fairly straightforward to animate it in that case. You would just animate the x-coordinate of your slice so that it lines up with where the object is supposed to be. It would be cleaner to do this as a python script, but it should work directly in the GUI as well.

As for the periodic conditions, my best recommendation is to tile the dataset using the Transform filter as shown in my thread. You may have to save a couple of separate animations (as images) and stitch them together into a movie, but that’s pretty normal.

Thanks for chiming in :slight_smile:

The object is not moving at constant speed although it does once it has reached its steady state, the orientation of its velocity also changes until it stabilizes.

My primary goal is not to create videos but rather to extract the fields around the object to do an analysis of the transition towards the steady state, I think I might be better of doing all of that with a python script, without using Paraview altogether…

Once I have imported my data into numpy arrays, I should be able to interpolate it as is done in Paraview, then concatenate them with duplicated versions of itself to create an infinite system, then
identifiy the object and extract the slice.

In the end I could still use Paraview to visualize the slices which I have created with Python…

If you’re doing it with Numpy arrays, I think it might actually be easier to subclass ndarray to allow indexing out of bounds, so that array[ind] returns array[ind%len(array)] or something similar.

How were you planning to determine the position of the object?

Ah, nevermind; I see it in your earlier post. Positioning and orienting the slices seems quite doable, probably in a pvpython script. The periodic nature of the simulation, though, is harder.

I have never created classes in Python, did you mean something like what is explained here ?

First I need to interpolate the data contained in the numpy arrays, as is done in Paraview.
Then take care of periodicity, then start slicing.

In the end I can extract the data from python and pass it to Paraview for visualization, so I don’t think I need to use pvpython

Actually I laid out things in the wrong order… please ignore previous comment.

First I get the equation for the infinite plane that will contain the slice, using the orientation and position of the object. I then take a subsection of that plane, that defines my slice in continuous space. If necessary, I apply periodic boundary conditions to the section of the slice which is outside the box.

Once that is done, I will have the coordinates in continuous space of the slice, which I can use to project the discrete field onto.