2D colouring of a surface of a given shape (Circular rake)

11
Image courtesy: https://arc.aiaa.org/doi/10.2514/6.2013-3796

Greetings,

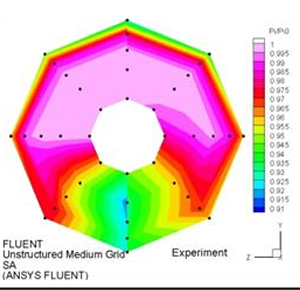
I hope this message finds you well. I am attempting to plot data similar to the attached image. I have scalar values at various points, represented in a CSV file with columns (x, y, z, scalar_value). I am looking for a way to achieve this visualization in ParaView.

I have considered using the Delaunay 2D filter, but it results in a flat surface. My goal is to create a visualization that resembles a rake, as shown in the image. Is there a method in ParaView to achieve this effect?

Thank you for your time and expertise.

Please share your data

Thank you for your response.

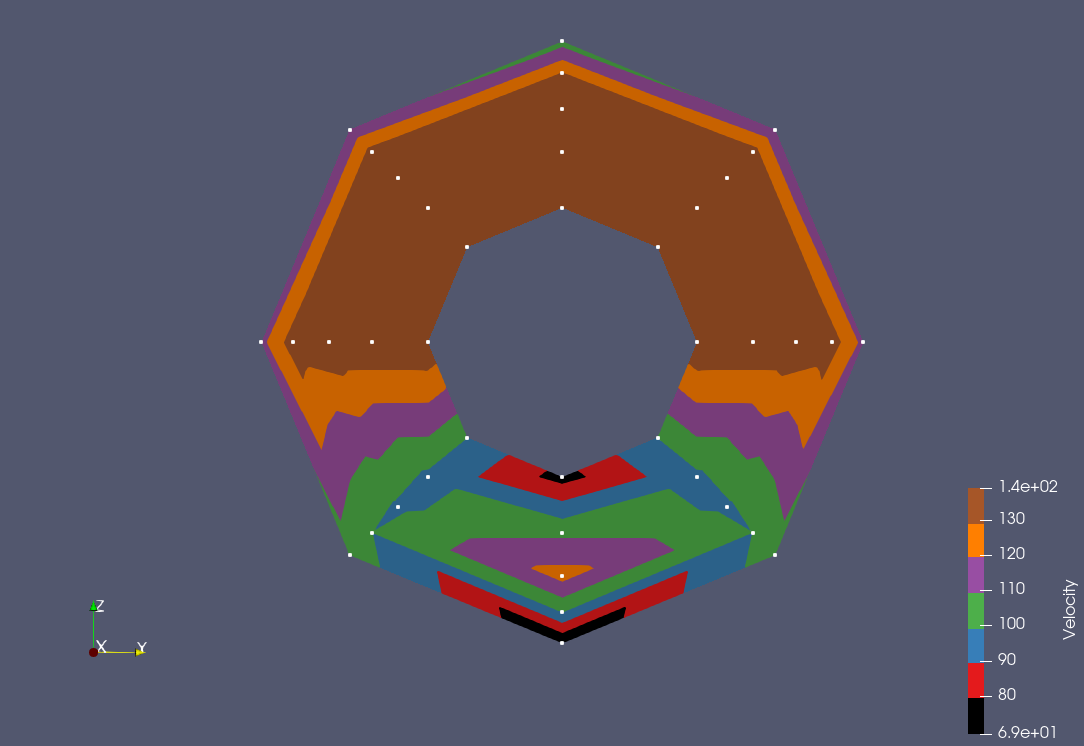
Attached is a CSV file containing x, y, and z coordinates followed by velocity magnitudes. These values were obtained by first inputting the CSV files of the coordinates into ParaView, where I had my CFD results. Then, I resampled at those points.
data.csv (1.5 KB)

Please let me know if you need any further information.

Best regards

Something like that ?

Please note I used delaunay 2D and then remove the cells in the middle manually.

state.pvsm (481.8 KB)

2 Likes

Hey Mathieu,

That’s exactly what I’m looking for. Could you please briefly explain the steps involved? Once again, thank you for your help.

Best regards,
Shariq

  1. Create geometry:
  • run ParaView
  • File → Open → data.csv → Apply
  • FIlters → TableToPoints → X, Y, Z, → Apply
  • Filter → Delaunay2D → BestFittingPlane → Apply
  1. Extract wanted cells
  • Switch representation to SurfaceWithEdges
  • Use “InteractiveSelectCellsOn”
  • Select the few cells in the middle
  • View → FIndData
  • InvertSelection
  • Filter → ExtractSelection
  1. Representation
  • Show TableToPoint as Point representation, increase point size
  • Show the ExtractSelection as surface, show “Velocity” variable
  • View → ColorMap Editor → Preset → All → KAAMS

hth

1 Like

Thank you for your support.
Cheers

1 Like