Hello,
I want to know if Paraview can be used to view 2D seismic data in segy format. The data is just one line.
Hello,
I want to know if Paraview can be used to view 2D seismic data in segy format. The data is just one line.
Just use File → Open… in the Prperty Editor, specify which bytes are holding the coordinates. Hit Apply.
I haven’t used segy data for a while. When loading a file holding several profiles, I noticed that Paraview connects these. Might have been solved by now… However, if you have a single profile, this is not an issue anyways.
S7_S7_D.sgy (301.6 KB)
Hi Venke,
Thank you for your response. I tried that but it didn’t work. I have attached my segy file, I will appreciate if you can help with that.
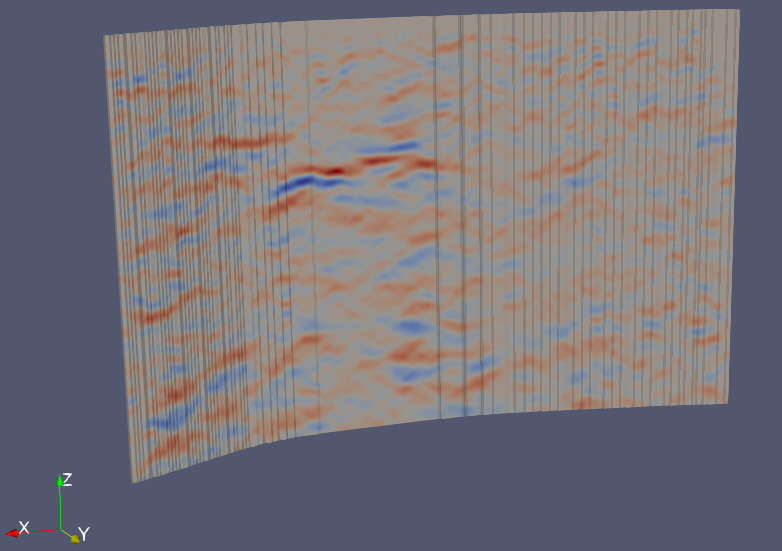
Thank you Venke. I have been able to do that. But is it possible to remove the black lines showing on the image?
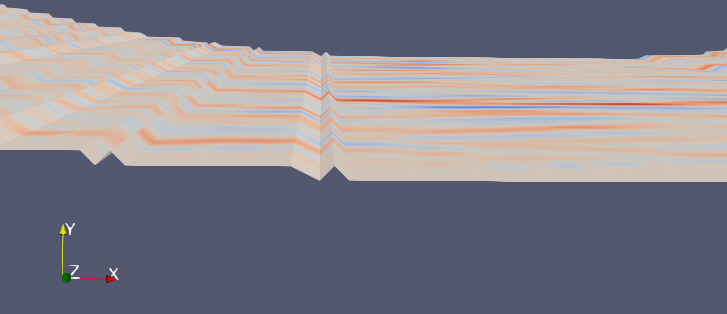
You can use the Lighting Settings, especially “Ambient” and “Diffuse” to make the image look better. The lines are crinkles in your data (made visible by the shading, see attached image with view from above), looks like a rounding issue in your coordinates.
Maybe there are other bytes with “better” coordinates in your data, or you can manipulate the coordinates such that the profile is smooth?