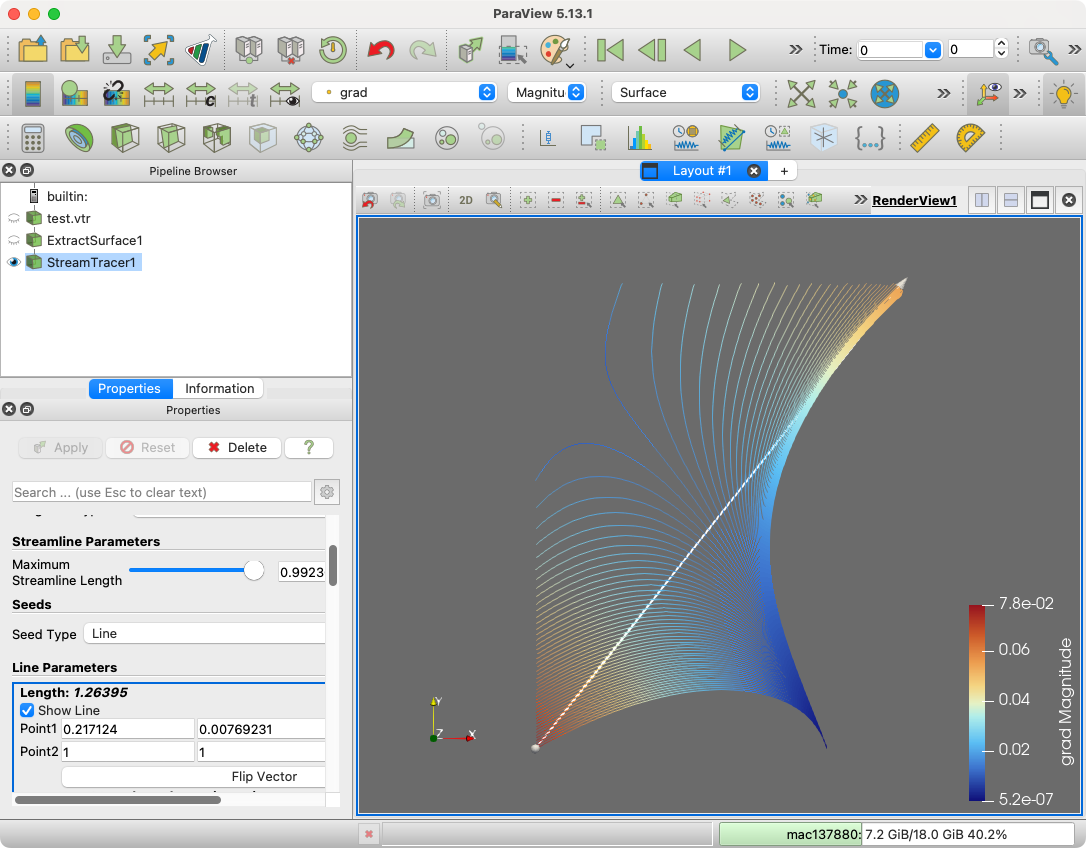
I’ve got some 2D rectilinear data, see attached (1.6 MB).
There are a couple variables in here concerning the gradient of some function. I’d like to make stream traces of this gradient function. In the attache data I am using the grad_norm variable for everything. Now, I can use the surface LIC and the Glyph filter in Paraview to get something that looks correct, but the stream traces seem to be using other data, and I am not sure where that data is coming from. (The stream lines are the gaussian points)
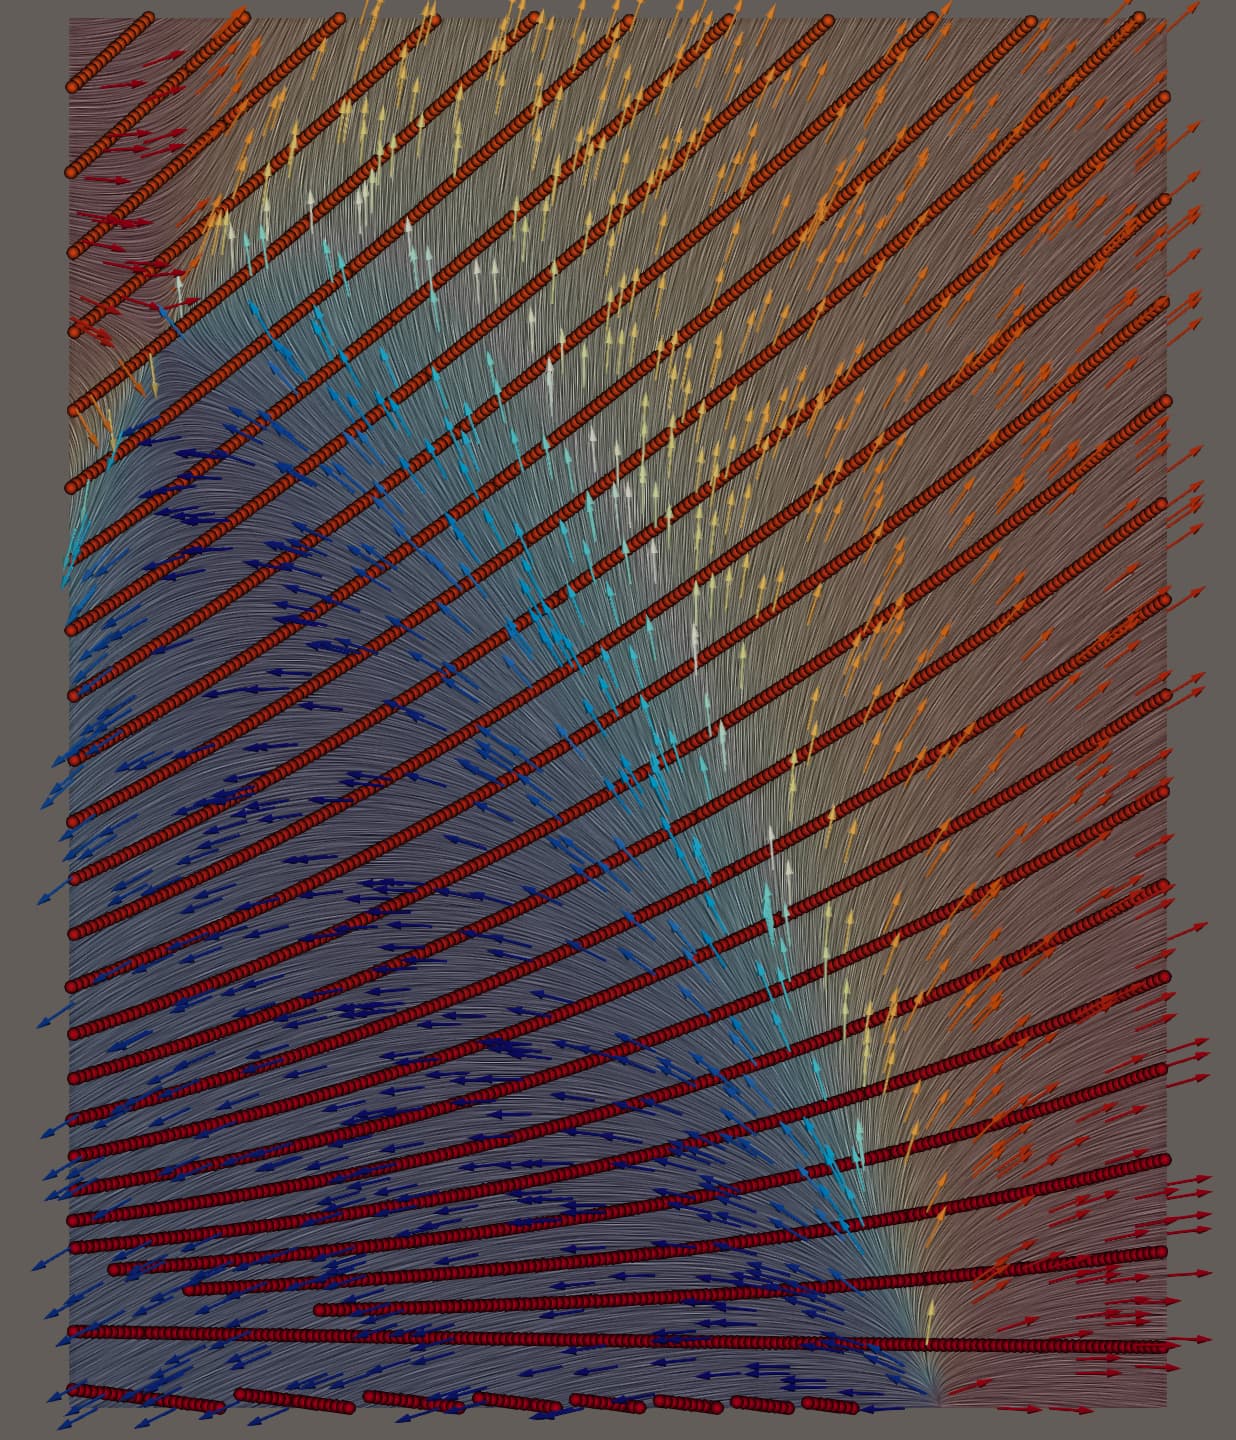
Does anyone have an idea what is happening?
(For reference, I get the same result in PyVista, so this is likely a VTK bug/issue/user error)
Running on the March 25th nightly build.