Hi, every one!
I am a beginner to Paraview.
Could someone help me to visualize the data please?
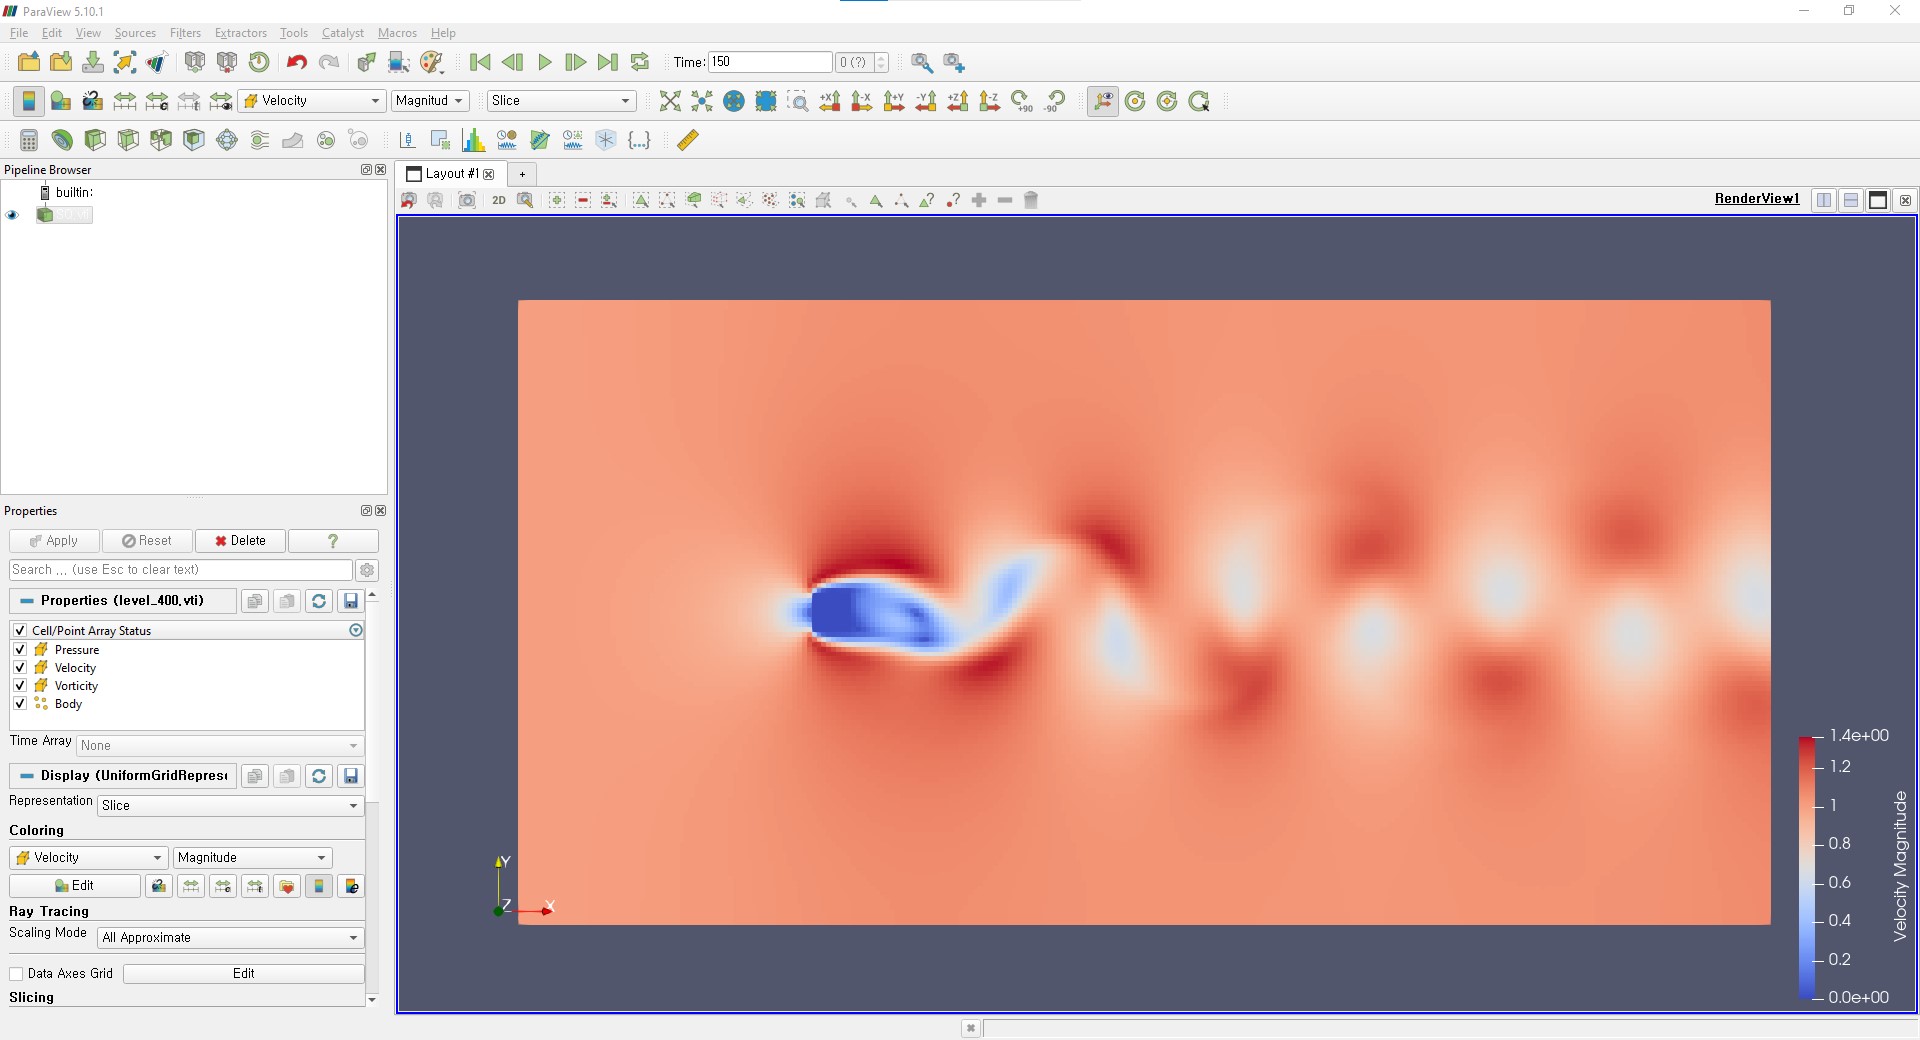
I have vti files where 2D velocity data also in.
level_400.vti (770.3 KB)
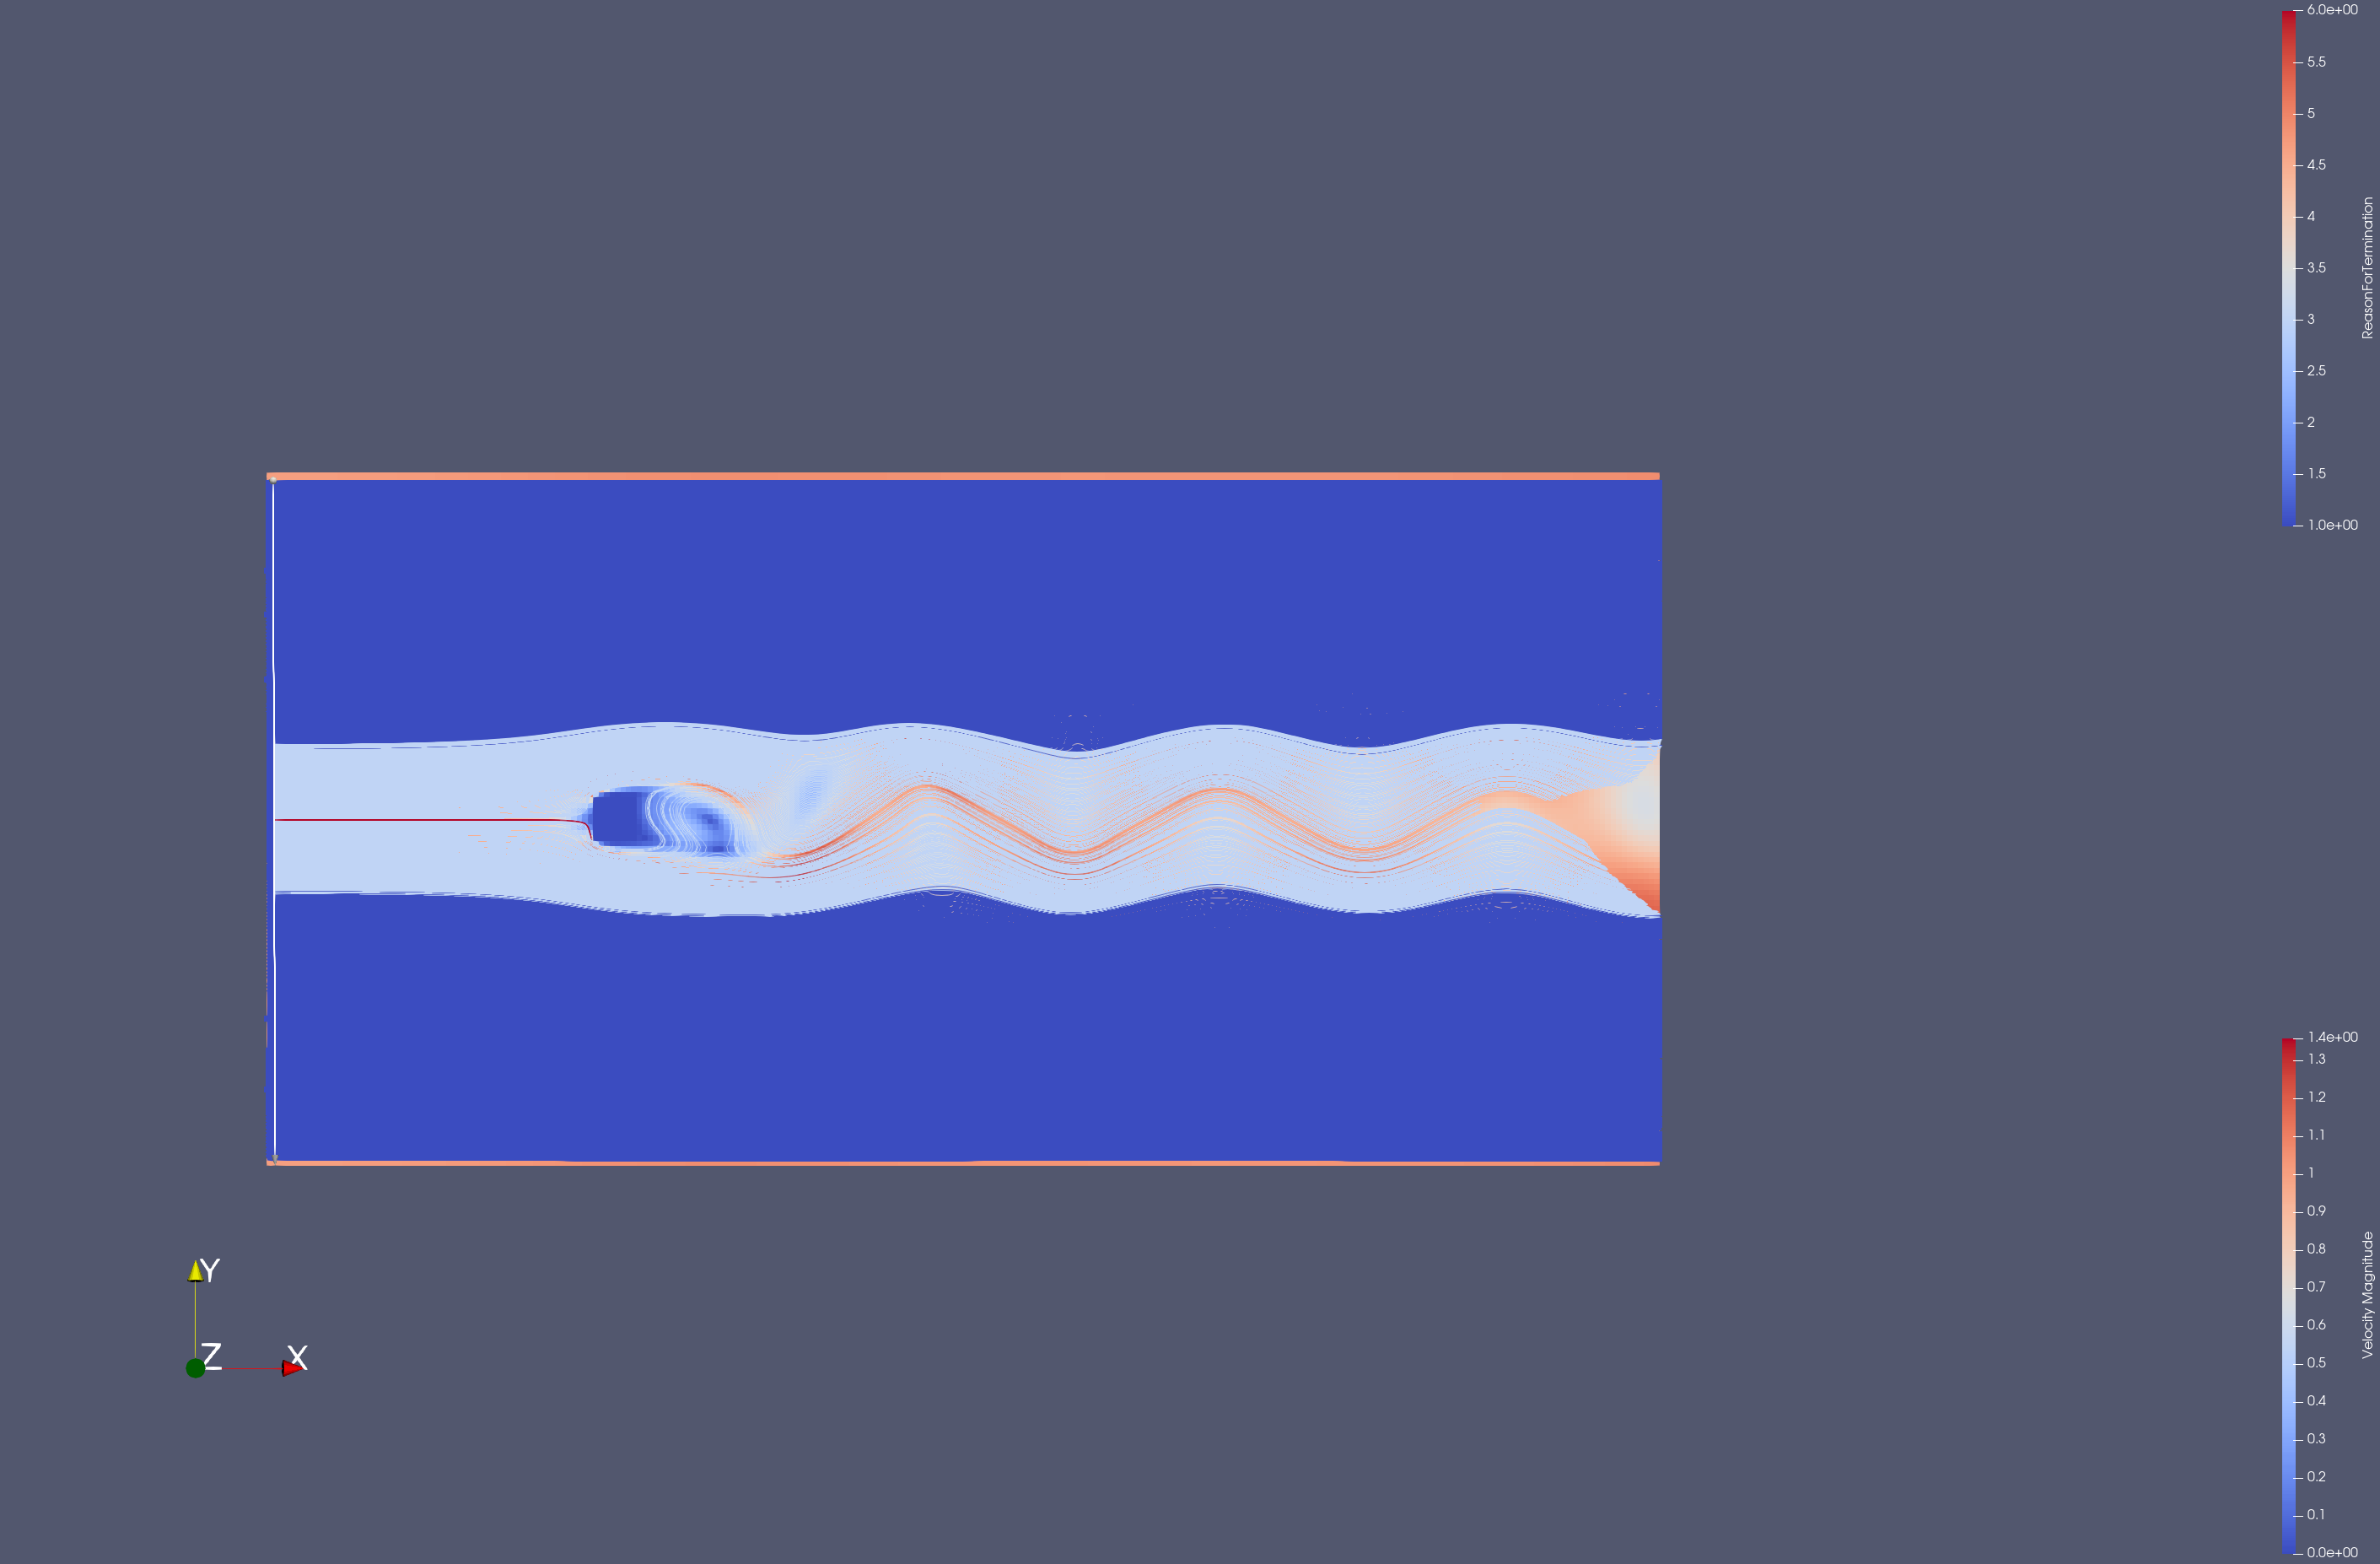
It works well that changes of velocity and voriticy can see obviously. But when I plot the velocity streamline using Stream Tracer, it looks really odd:
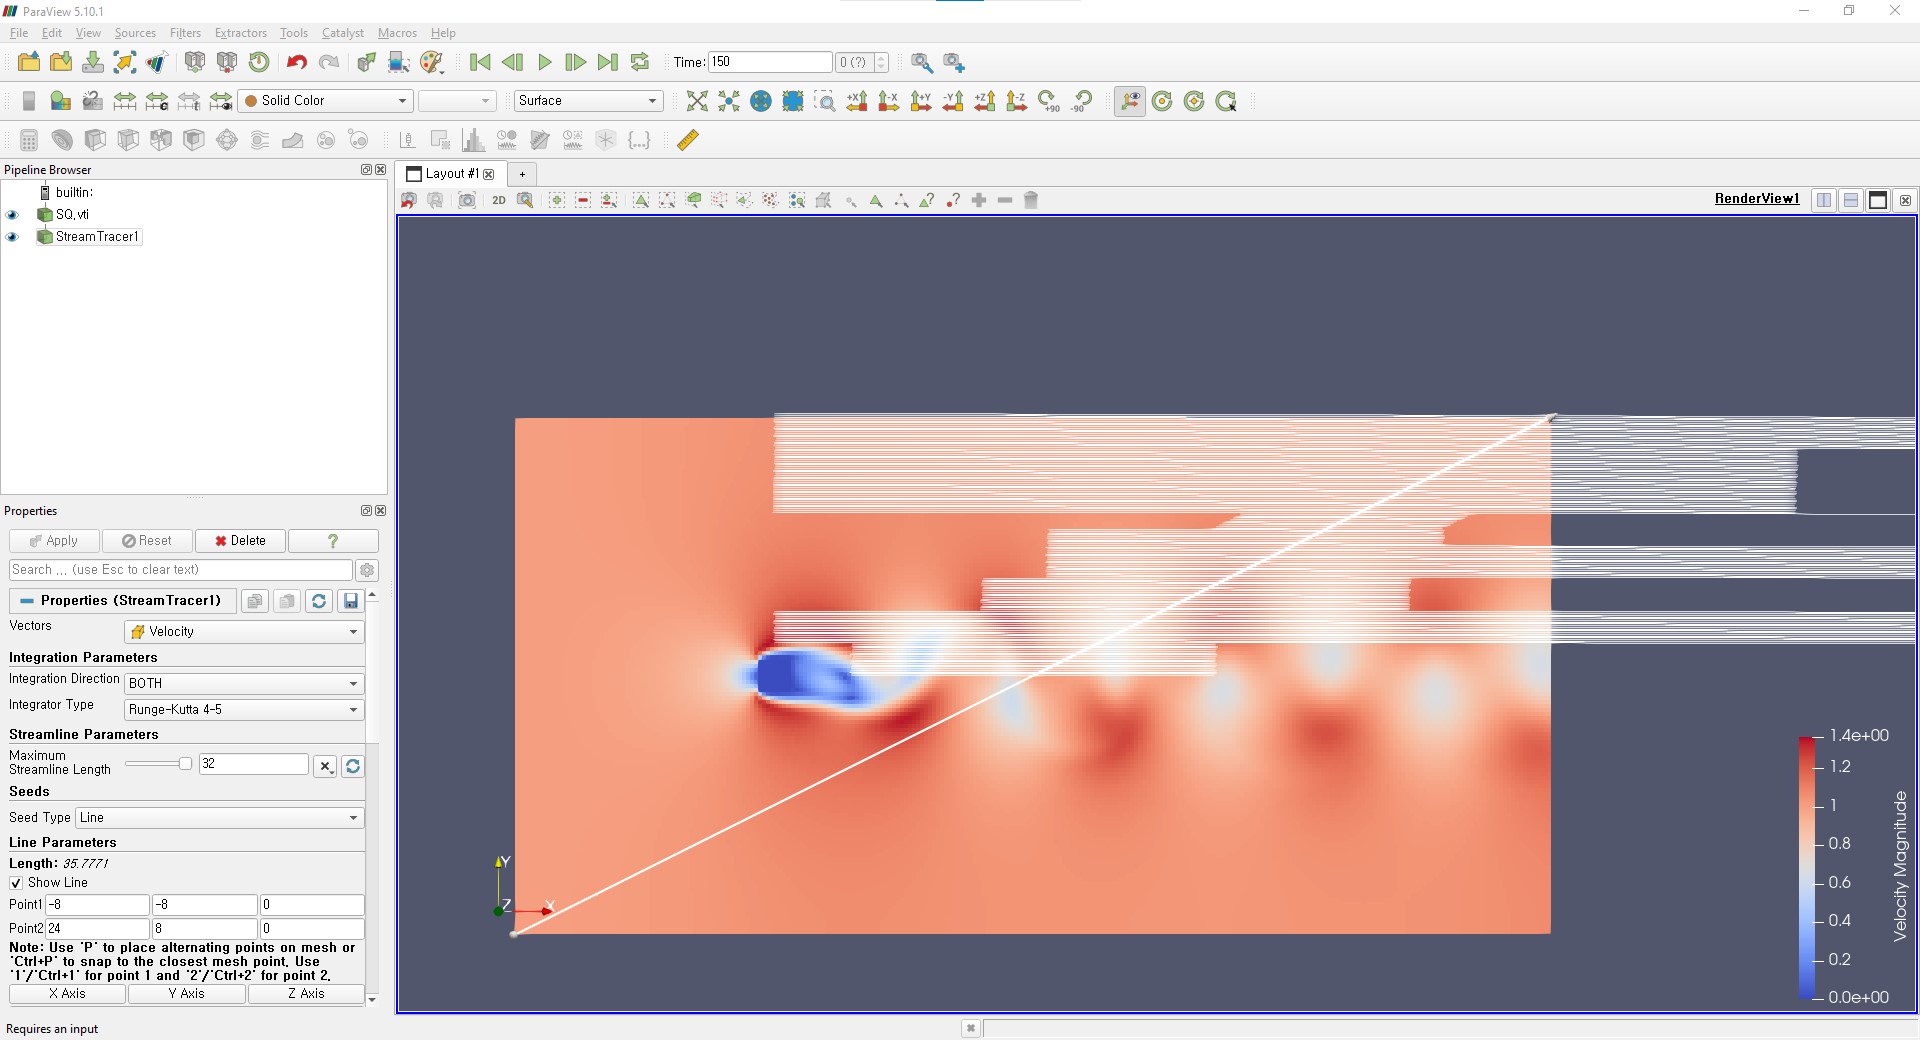
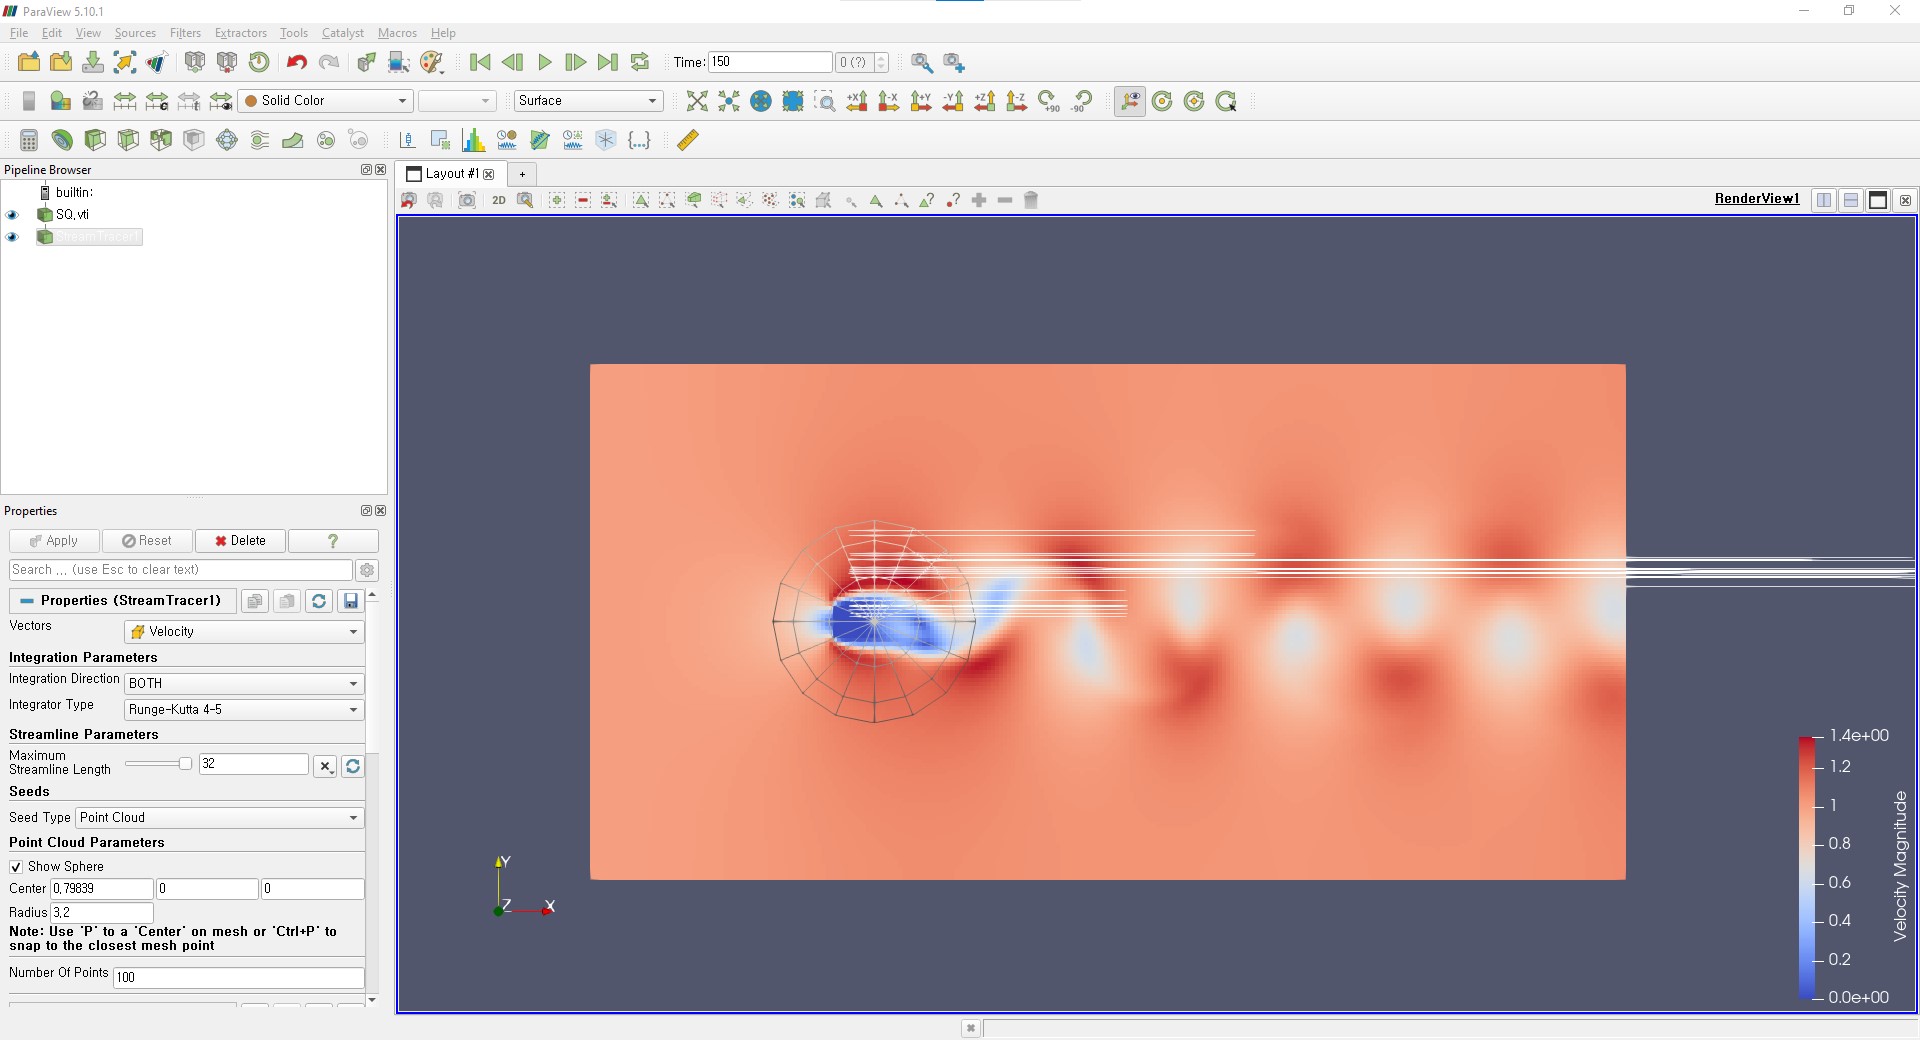
Could someone hlep me some hints to get meaningful streamline around the object?
Thank you so much!
Sopo.