As you said, your data has circular streamlines. Probably what is happening is that you are getting lots of streamlines on top of each other, and its rendering looks solid.
When I run streamlines on your data, I get something a bit different:
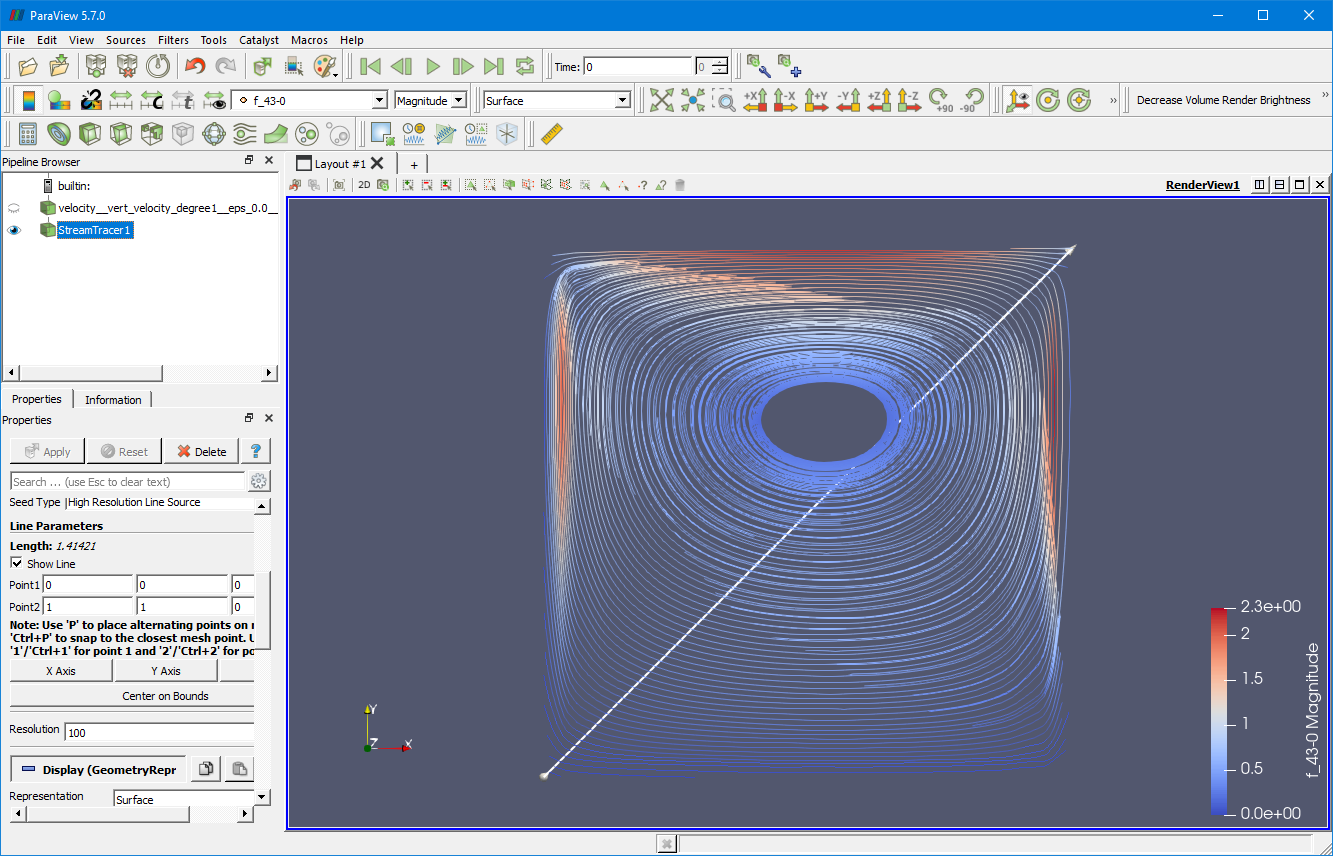
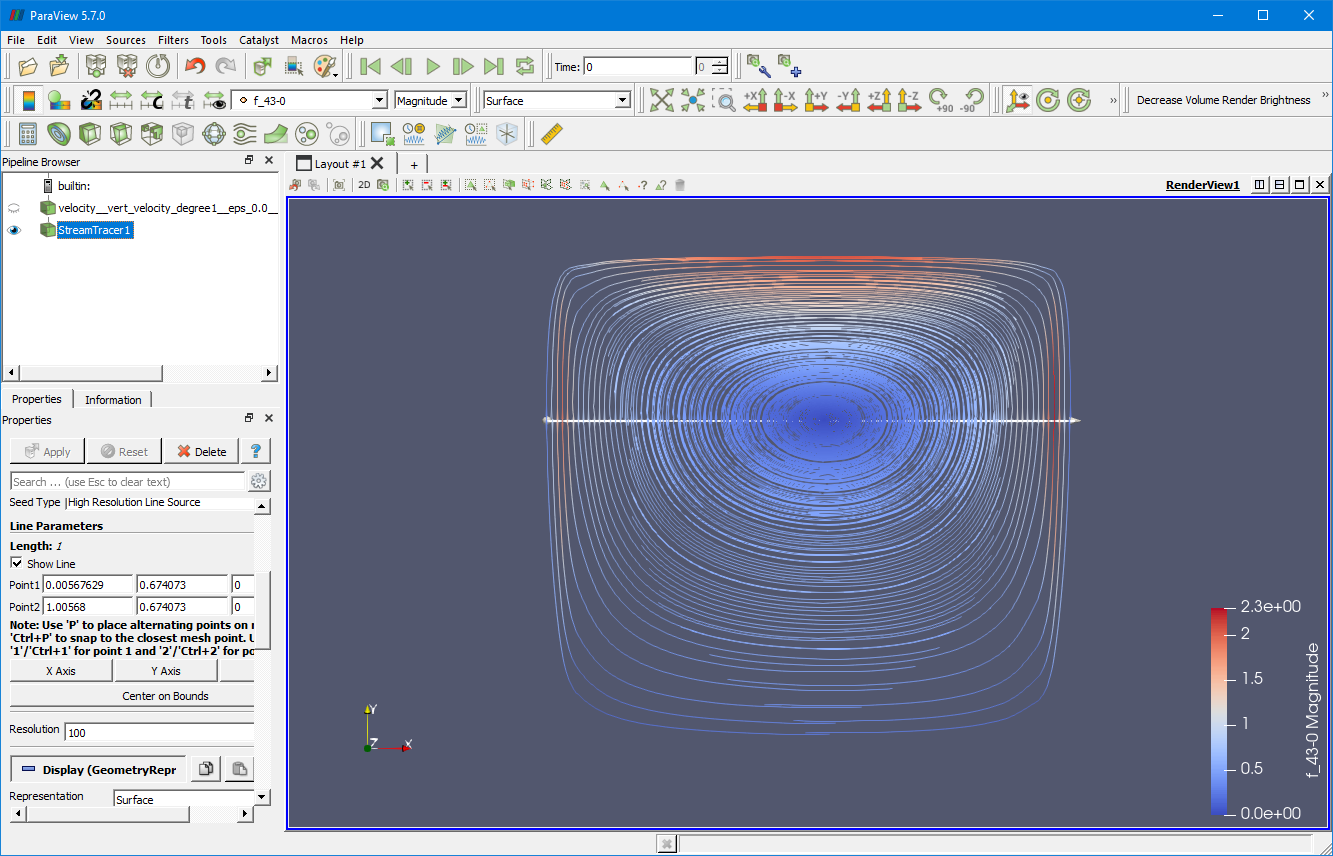
The default behavior of the Stream Tracer is to define a line along the diagonal of your data and then seed the streamlines with 1000 points along the streamline. 1000 is excessive in your case, so the first step would be to reduce the Resolution parameter. If I reduce the Resolution parameter to 100, I get this:
Now you can really see the streamlines. This might still be more than you really want, but you can further reduce the Resolution parameter to get fewer streamlines.
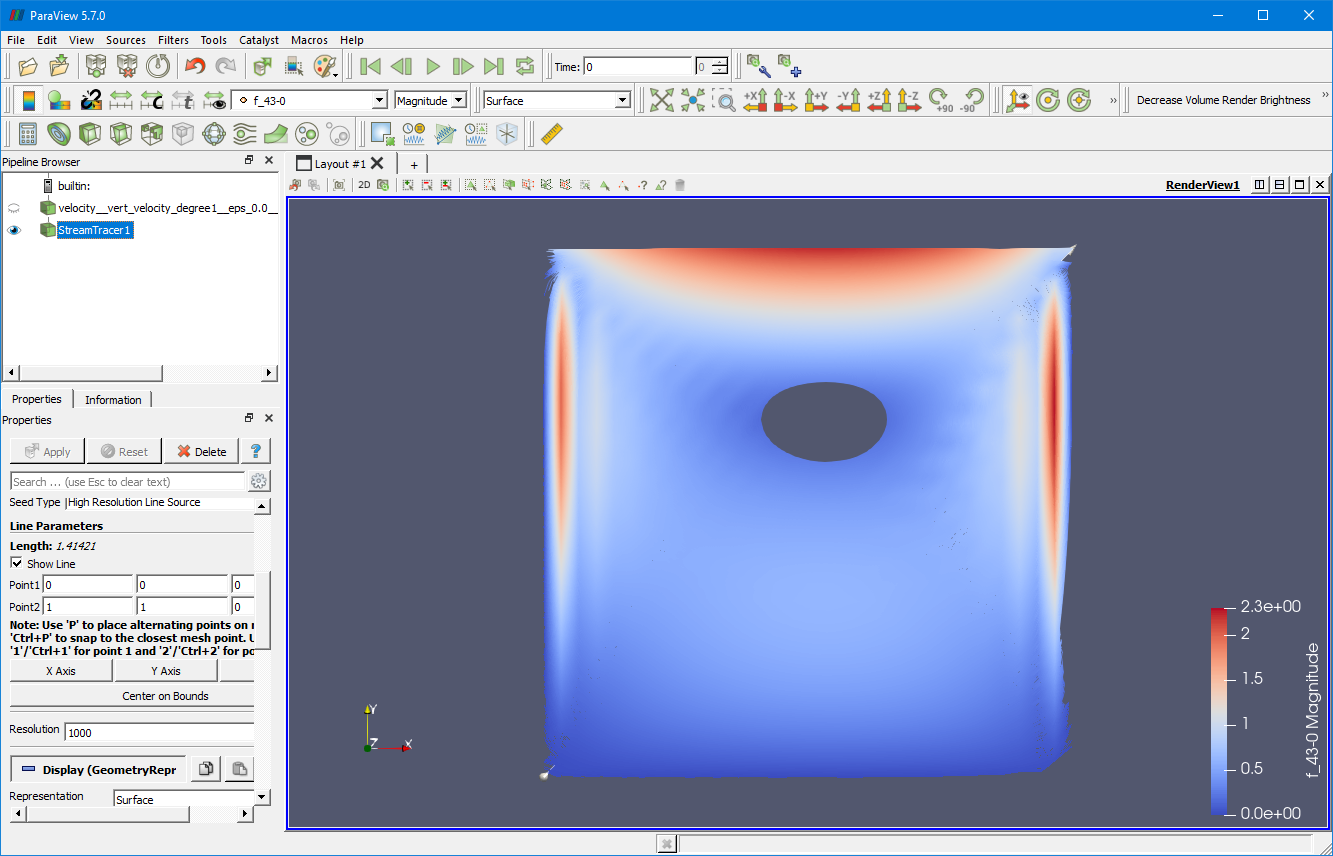
You might also note that there is a “hole” in the middle with no streamlines. This is because the line does not go through this part of the model so none of the seeds are on a streamline in this region of the model. If you want to see streamlines here, you can fiddle with the seed line to go through that part. For example, here is the result when I change the line to be along the X Axis and going through the center of this region.
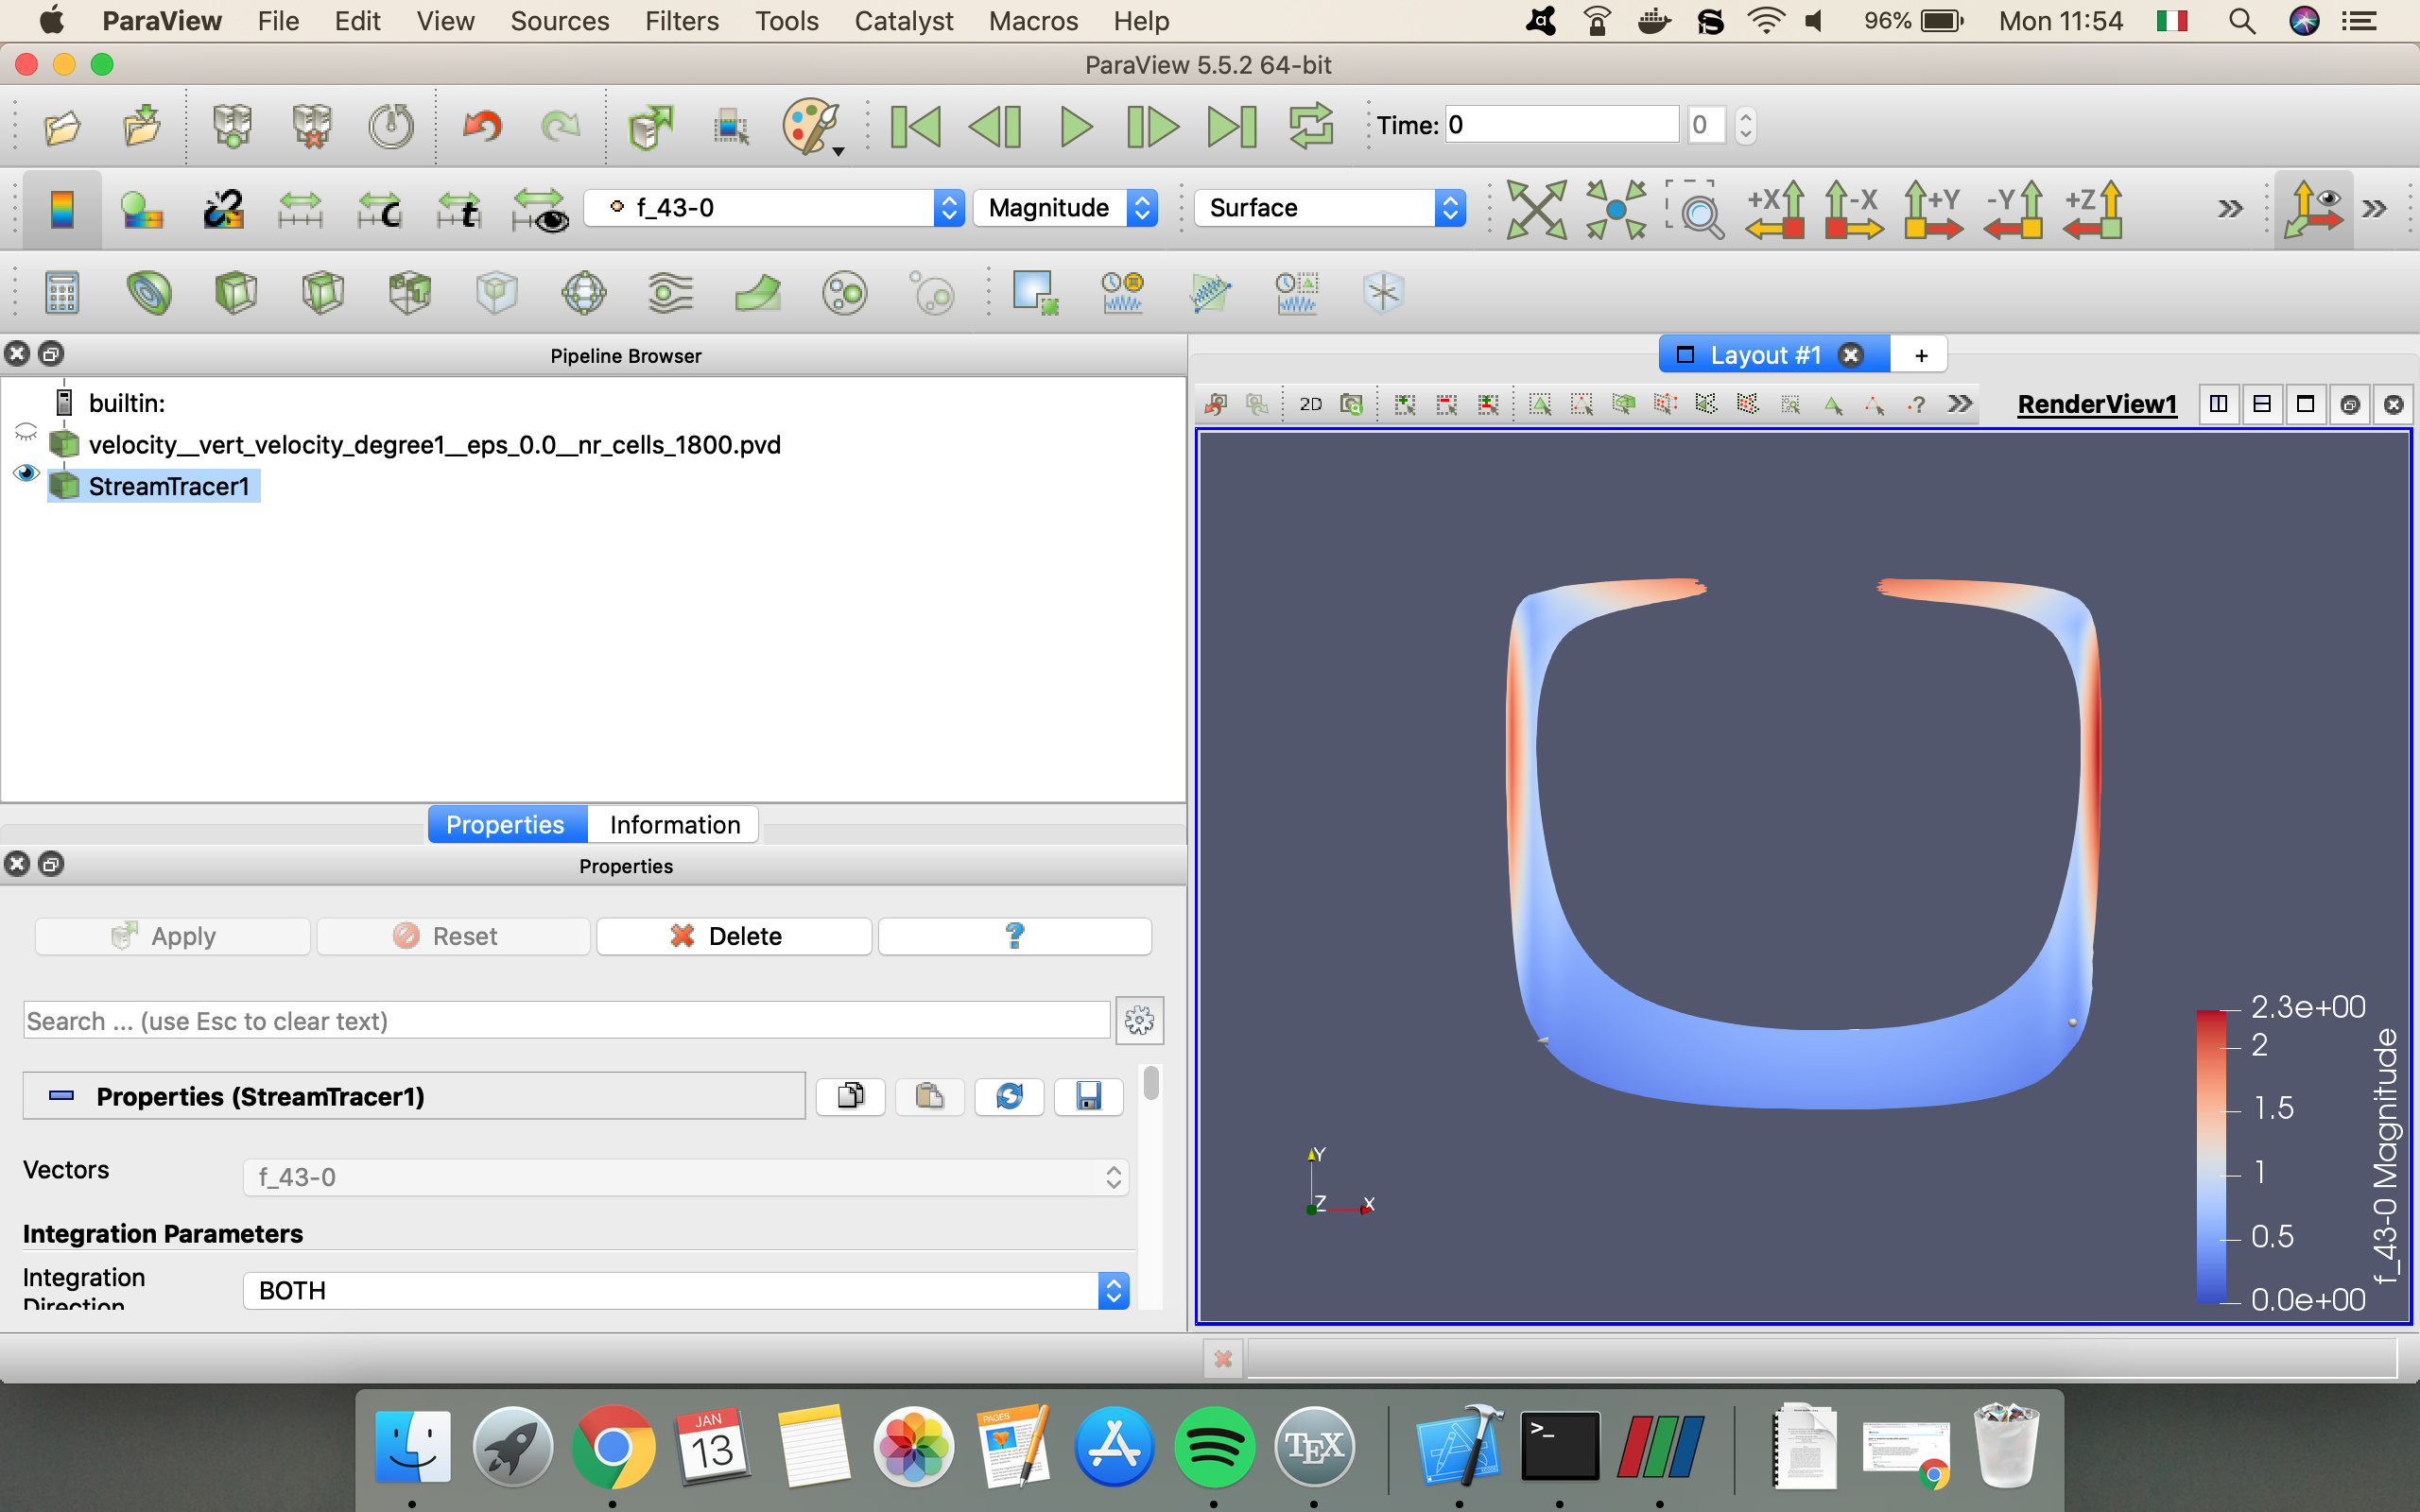
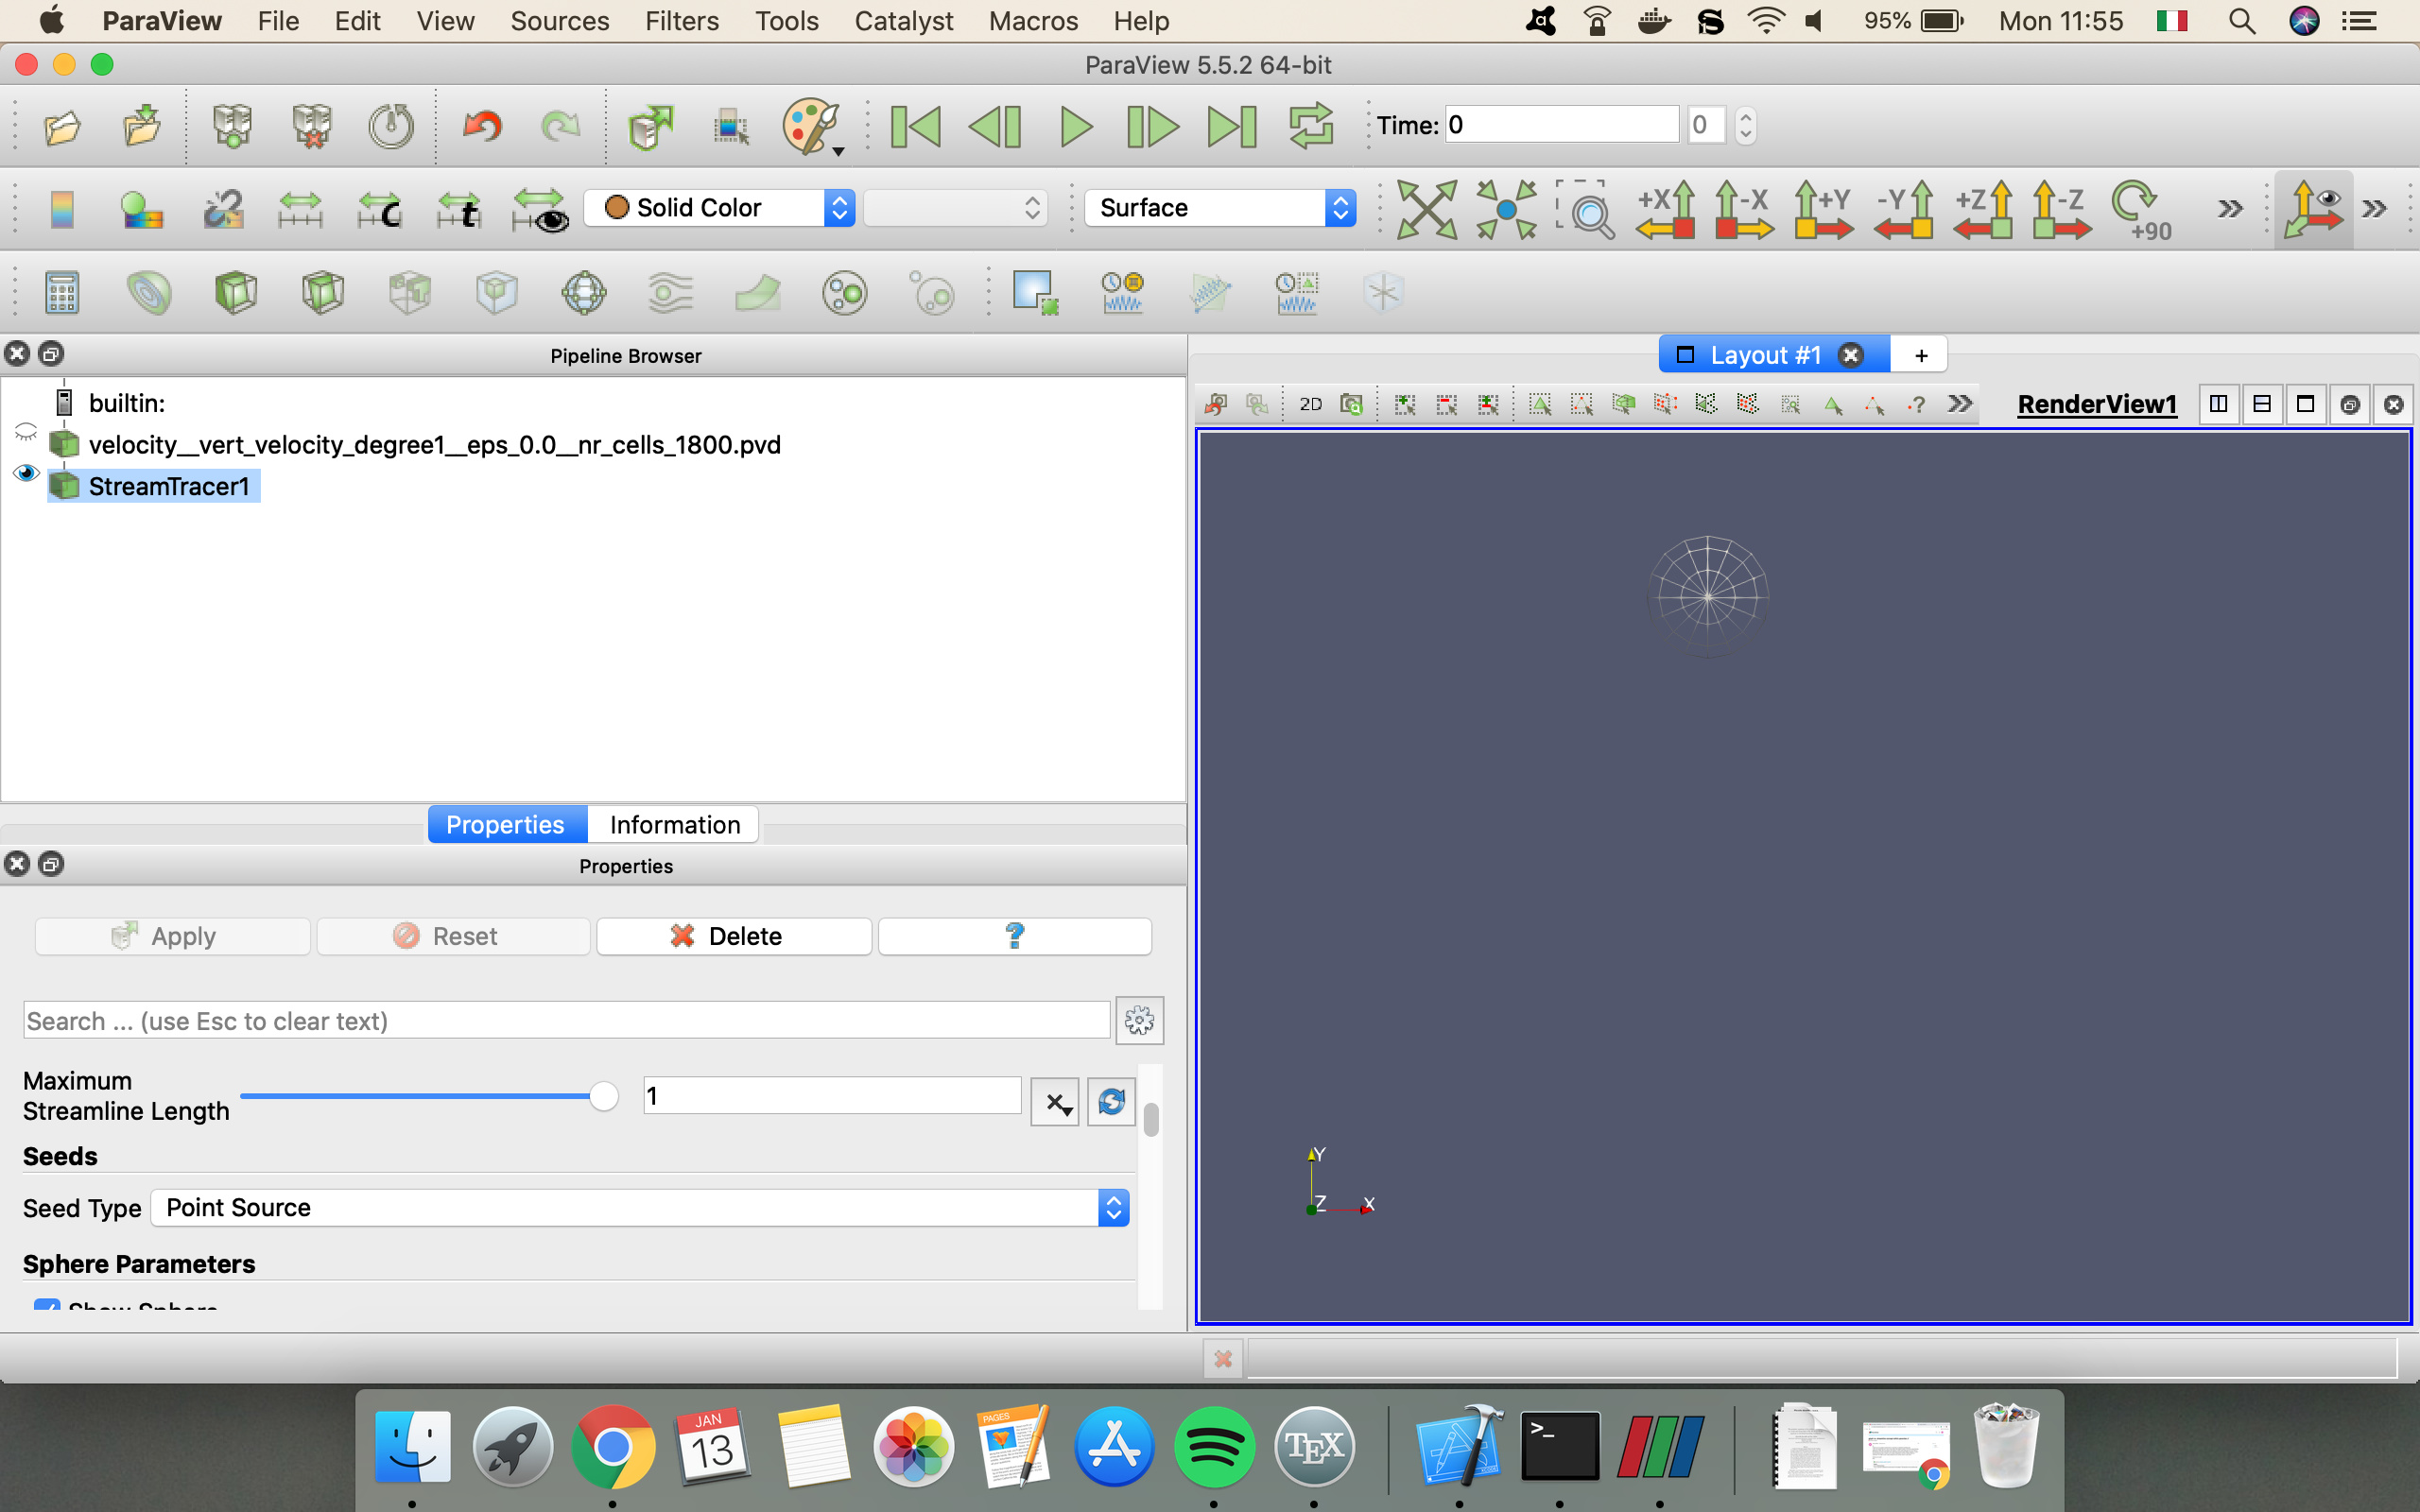
BTW, the reason why you get nothing when you select Point Source as the Seed Type is because the Point Source actually randomly creates seeds in a sphere of a given radius. (You can see that seeding sphere as a 3D widget in the view.) The problem is that a seed has to be exactly on the 2D surface you are trying to make streamlines for, and since the seeds are randomly placed, that never actually happens.
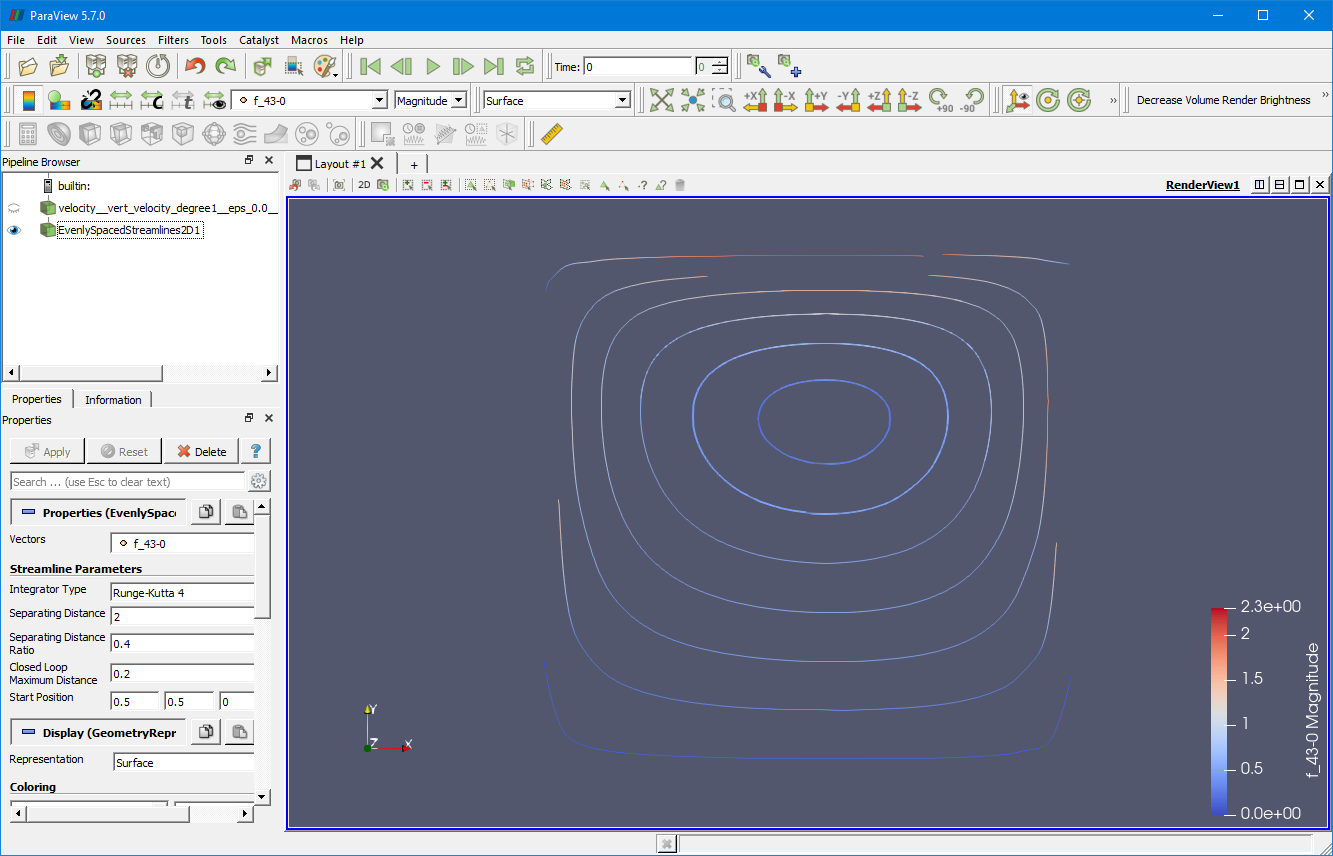
There are also a couple of alternatives you can try that might give you something closer to what you want. First, filter named Evenly Spaced Streamlines 2D. Rather than make you select seed locations for the streamlines, it seeds the streamlines for you using an algorithm that attempts to evenly space the streamlines. (See this blog post for more details.) Applying Evenly Spaced Streamlines 2D, I get this:
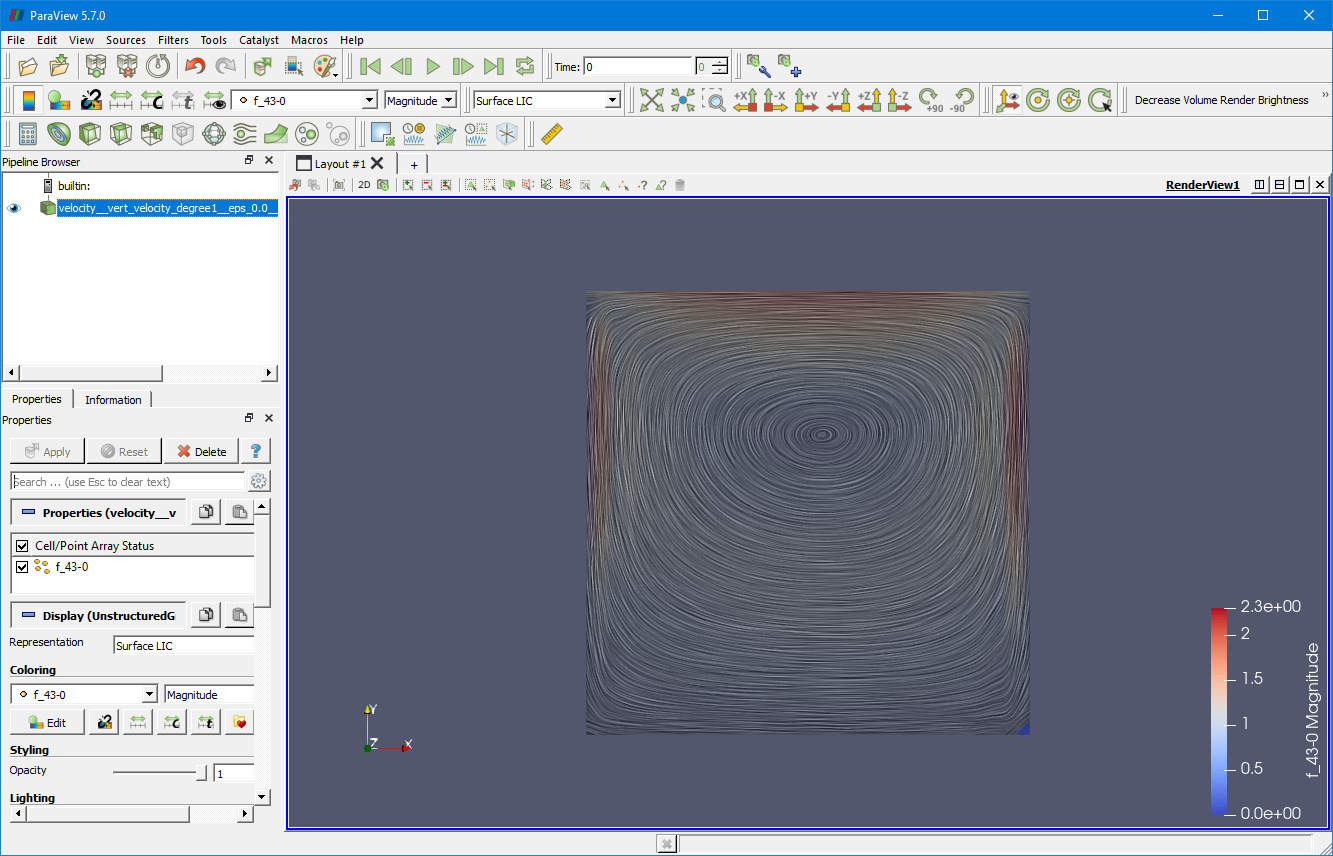
Finally, since you have a surface, you might be interested in viewing your vector field using a LIC instead of streamlines. ParaView has a plugin called SurfaceLIC that lets you draw a continuous field of streamlines (sort of). To use it, when you first load ParaView, go to Manage Plugins... and load the SurfaceLIC plugin. Then open your data and change the representation to Surface LIC. Here is what I get when I load that on your data: