I need to plot my data as a 3D scatterplot, using discrete data points (no triangulation to create a surface), with such control over the lighting/shading/shadow effects that the 3-dimensionality really pops out at you. (This is for publication in a journal, so the final image will be quite small, thus the 3D effects are critical.) Since lighting effects on actual data “points” don’t make sense, I will need to use little spheres to represent my data so that there is a surface that can scatter light, and a 3d object that can potentially cast a shadow if needed. Can Paraview do this? As an example of what I’m looking for, see this image. (I can’t use that software because it isn’t free and there is no Linux version.)
ParaView does not have the 3D Scatter plot as far as I know. Instead, you can use the parallel coordinates plot to show the 4 variables shown in the linked image (3 variables + sphere radius). You can also link the parallel coordinates plot with 2D scatter plots to get similar information as in the linked image. See the ParaView Guide for more information.
Dan
Parallel Coordinates View currently crashes. https://gitlab.kitware.com/paraview/paraview/issues/19409
Actually, it is not difficult to do something similar to the plot you provided. A few Programmable Filters will come handy.
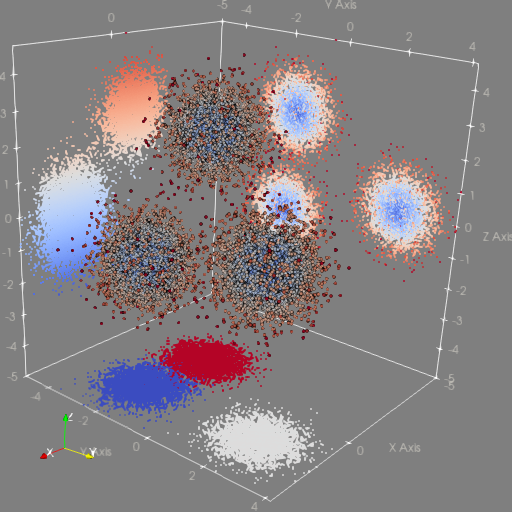
I displayed the original 3D dataset as “Point Gaussian”, and I made 3 projections of the data to each “wall”, The following python code would do that and project data to the z= -5 wall
import numpy as np
pts = inputs[0].Points
N = inputs[0].GetNumberOfPoints()
output.Points = make_vector(pts[:,0], pts[:,1], -5.*np.ones((N,)))
Turn your “Copy Arrays” flag ON, and you’re done. Repeat for the projection to the X and Y walls. Use appropriate offsets.