Hi everyone,
I’m not very experienced on Paraview world.
I have a trouble about the best solution to create a 3D visualization
from unregular points distribution.
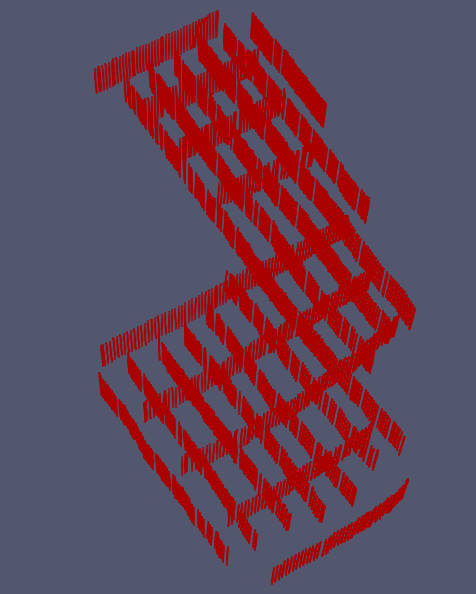
Attached the table to point filter of my dataset. Red points are the data
and I want to reproduce a 3D picture. A good solution could be to create
a table to structured filter but some parts of the 3D need to be blanked
because at the corners of this L-array I have no data.
Moreover, if the data have topography it’s not easy to define the minimum and maximum extension along the axis.
Can you suggest me another solution?
Best regards,
Lorenzo
3D.bmp (828.4 KB)
Please share your file
I see the attached file. It is named 3D.bmp
This is a screenshot.
I can’t share data without my company’s permission (Italian National Research Council).
I enclosed the screenshot just to make clear the request.
I have irregular data, with or without topography. How can I get 3D picture?
thank you in advance,
Lorenzo
TableToStructuredGrid do not support blanking.
TableToPoints + RessampleToImage could work.