I want to visualize 4D Flow Data from MRI measurements with streamlines and/or pathlines.
Right now, I have a Dataset of 20 VTK files (20 time steps). The file format is structured grid and the files contain velocity values for each three dimensions for each point. So I have overall three scalar fields for x-, y-, and z-velocities.
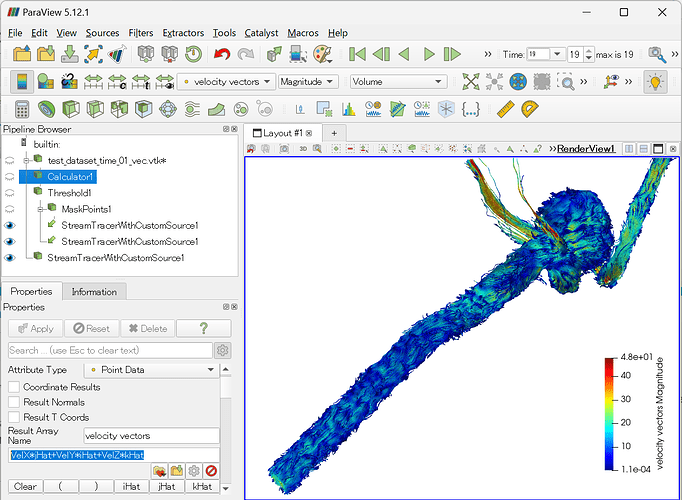
I use the Calculator Filter to create one vector field out of the three velocity components.
(In order to do a segmentation of our vessel model from the rest of the unstructured grid, I then apply a Threshold Filter but later we will use the unstructured grid format anyway and do the segmentation before loading the data into ParaView.)
Then, I create streamlines as suggested in this discussion (but I also wrote down the steps below): https://groups.google.com/g/crimson-users/c/oh9VgWSgvWU?pli=1
First, I apply a Mask Filter with „On Ratio“ 20 and „Maximum Number of Points“ 5500. (Because I have a little over 100000 points. Divide by 20 → about 5000 points.)
Then, I use the Stream Tracer With Custom Source Filter and choose the Threshold Filter as my Input and the Mask Filter as my Seed Source.
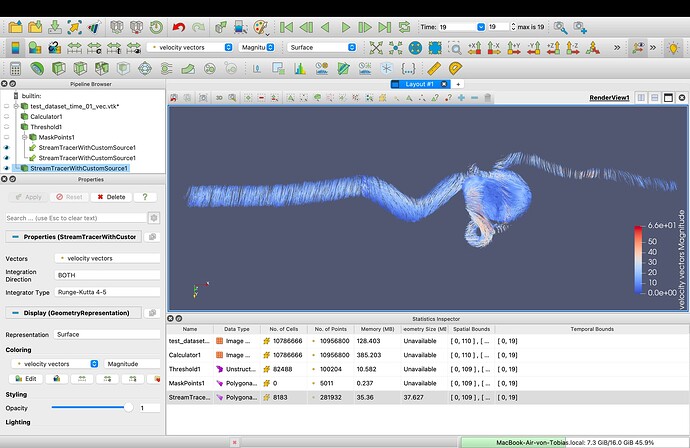
In the rendering I get the streamlines but they behave very unexpectedly, especially in the ingoing and outgoing vessels of the model where they are oriented vertically instead of horizontally. They also end where they intersect with the vessel instead of staying inside of it.
When I used the standard Steam Tracer Filter and placed the seed in these areas, the streamlines looked the same and were „cut off“ at the borders of the vessels, therefore increasing their length did not have any effect.
However, when using the same dataset on a commercial software, the flow looks right so I do not think this is an error in the data.
Maybe I got something wrong — is there a better method to make streamlines? Maybe something is wrong with how I created the velocity field (Calculator Filter)?
I also tried to visualize pathlines with different filters but they all showed similar behavior.
I am still new to ParaView, any help appreciated!
Link to the dataset: data.zip
try_streamlines.pvsm (707.3 KB)

