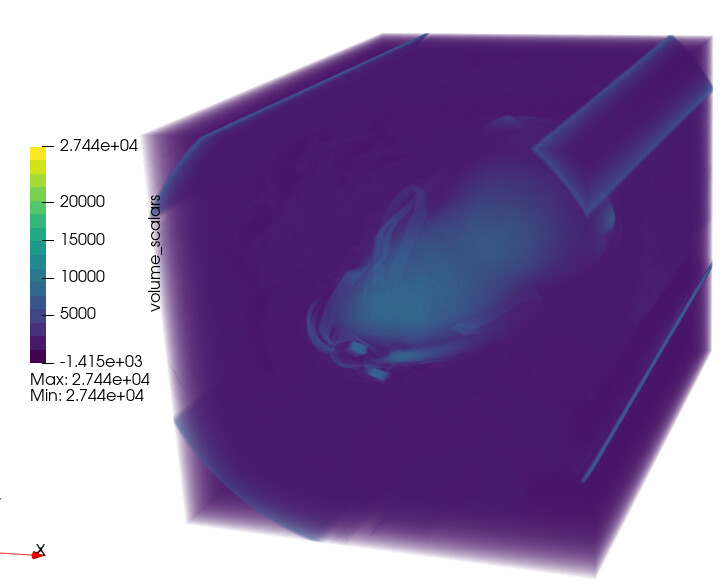
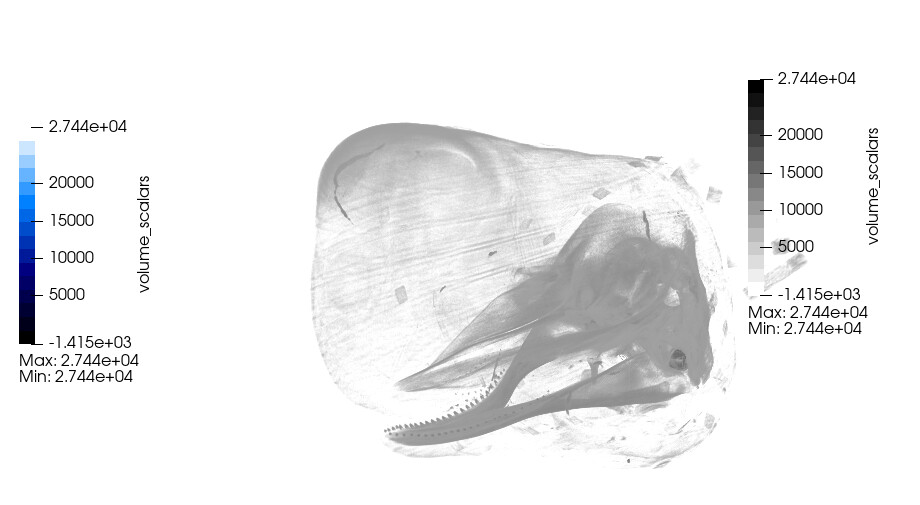
The legend minimum and maximum are displayed as the same (they are not), and when the color map is switched, the old legend stays on the plot, together with the new legend. Win 11.
I had to get back to 5.13, this was a dealbreaker.
The legend minimum and maximum are displayed as the same (they are not), and when the color map is switched, the old legend stays on the plot, together with the new legend. Win 11.
I had to get back to 5.13, this was a dealbreaker.
HI @PetrKryslUCSD thanks for your report. Could you spell out step-by-step how to arrive at this behavior?
I’m afraid I am not able to reproduce what you are seeing with a ParaView 6.1.1 installation. Do you have any non-default settings, e.g., the General setting called Scalar Bar Mode?
The wrong Data Range Labels reminds me of this issue which looks to have been solved in ParaView 5.13.3. https://gitlab.kitware.com/paraview/paraview/-/work_items/22661
Is it possible to share this dataset? If not, I can try to produce some synthetic test data to reproduce this problem, but I need info about the volume. It looks like it has a single 1-component array named “volume_scalars” that ranges between [-1.415e3, 2.744e4]. Can you confirm that it has a single component? Data type (float, double, int, etc) would also be helpful to know. You can find this information in the Information panel.
One other idea - I have seen behavior like this before when a configuration file has gone rogue. Running ParaView 6.1.1, try resetting your configuration file. Edit/ Reset To Default Settings. Please choose “Yes, and backup current settings”. Then follow directions (i.e., exit ParaView and start again.). If this fixes it, Kitware may want your broken configuration files.
I face the very same problem as described. I tried your suggestion @wascott, without success.
I can share the data. In my case I ran FEniCSx, and saved a folder.bp. Inside that folder, 4 files (that I attach here),
profiling.json (394 Bytes)
data.0 (5.3 MB)
md.0 (1.8 KB)
md.idx (128 Bytes)
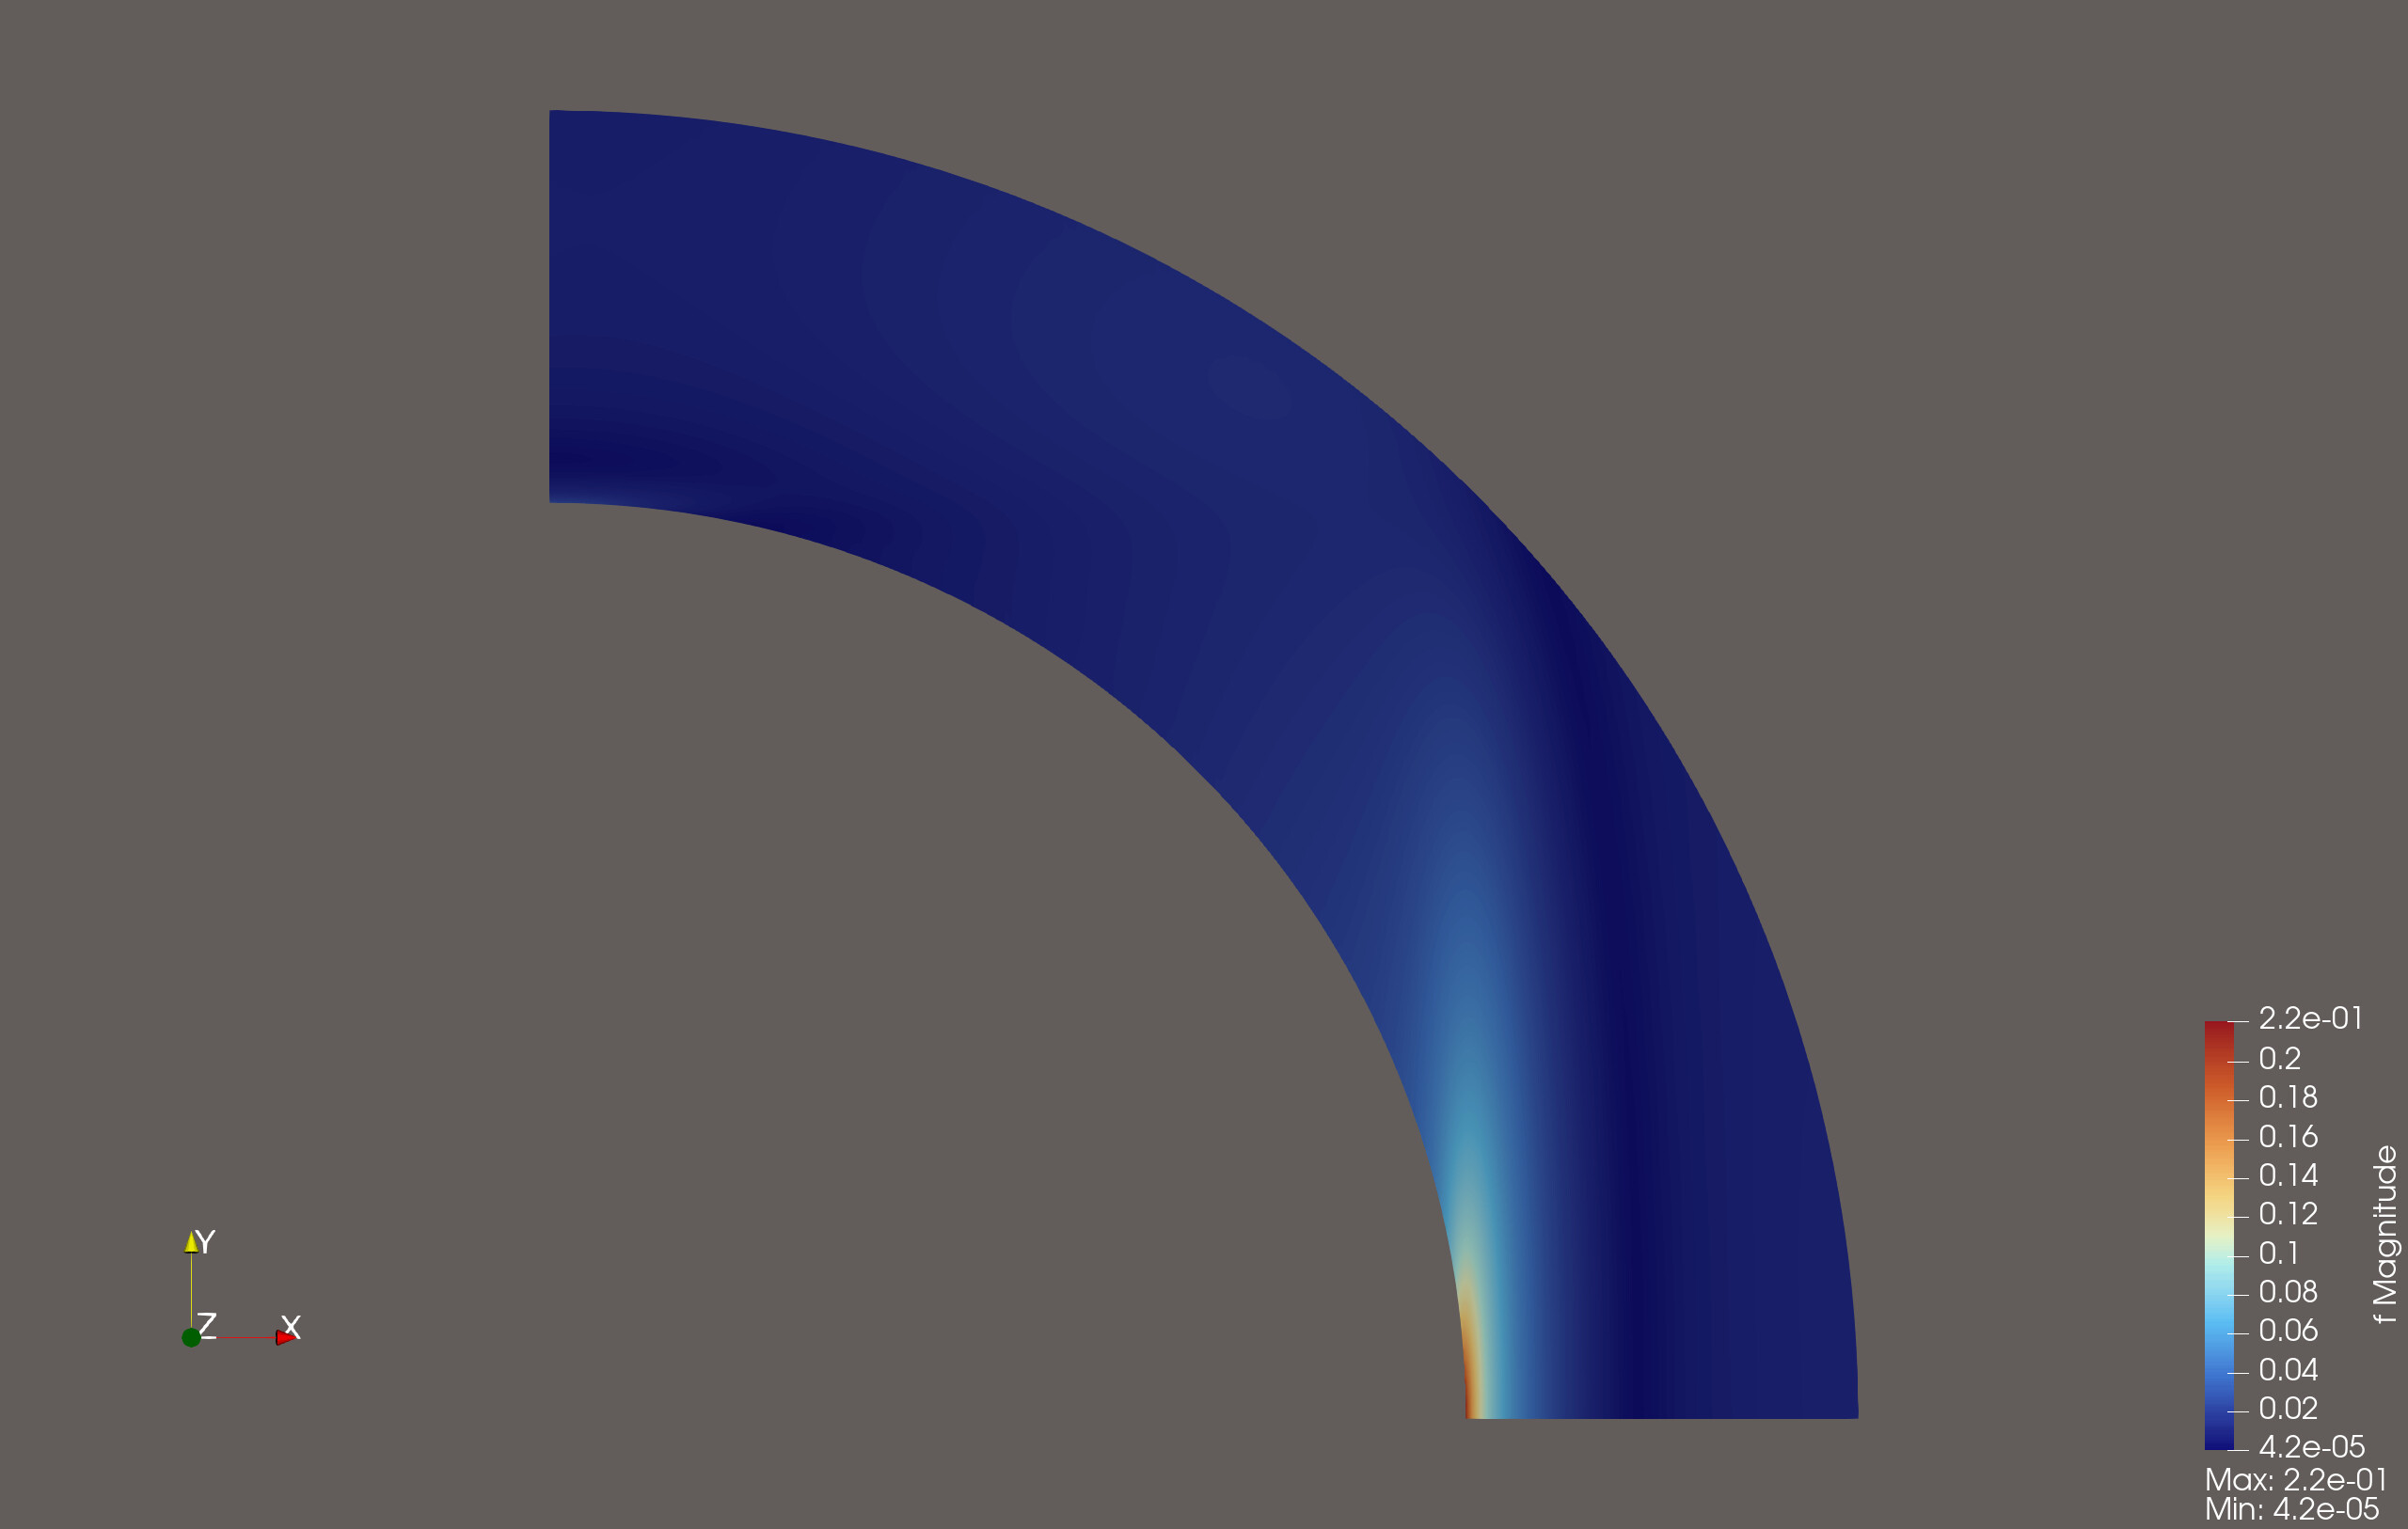
So the mininum value should be near 0, but it shows as 0.22043168 which is exactly the same value as the maximum value.
Note that when I click on “Custom range”, by default the “true” minimum and maximum values are displayed: 0.00004231 as min and 0.22043168 as max. Unfortunately those aren’t shown in the legend. So yeah, the legend is broken…
By the way, I am also using Paraview 6.1.1 but on Arch Linux.
Thank you for sharing your data and experience, @Bismuth-tetser.93. When I do the following with ParaView 6.1.1 on macOS, I see what looks to be the correct Min and Max displayed in the color legend:
The values in the “Set Range” dialog are [4.230746157631049e-05, 0.22043168375631383], which is what is displayed.
I also tried 6.1.1 on Ubuntu and observed the same.
Am I missing a step? Do you have any ParaView settings changed? I would very much like to figure out what is going wrong here.
That sounds suspiciously like a bad configuration file. Try Edit/ Settings/ Reset to Default Settings (near the bottom). and follow directions. You may want to say “Yes, and backup current settings”. If this fixes it, Kitware may want those files for debugging.
You’re not missing anything, this is exactly what I had done. I don’t know whether I changed the default settings, possibly.
@wascott yeah I had tried to reset my settings, to no avail. I did not manually deleted any file though, so I will try that.