I want to do something like this youtu.be/Asw4usQCqs0?t=183 - visualization of points in time. I loaded the points using the TablesToPoints filter, but I don’t know how to make the points appear in time. Do you know any way?
There is no easy way, you basically need to write your own programmable filter that will extract the data and timesteps and convert it to an actual temporal dataset.
There would be a way to use an existing plugin. PythonAlgorithmExamples
This plugin reads a CSV file as time series data if it contains a ‘time’ column.
But before that, you need to add the ‘time’ column to the EVENTS.csv using the trivial python script add_time_col.py (add_time_col.py (1.3 KB)). The run command is below:
python add_time_col.py
Then EVENTS_out.csv will be output. EVENTS_out.csv (21.8 KB)
However, for your purposes, this plugin ‘PythonAlgorithmExamples’ could not be used as is, and the following changes were necessary:
Modified to read string arrays
Modified to read all points before the current time
Now load this modified plugin into ParaView. Tools > Make Plugins...
Then load it via the Load New ... button.
Next, EVENTS_out.csv is read by specifying the plugin reader Python-based CSV Reader. When loaded, the data is read into the Spread Sheet as a table, which is then converted to points using the Table To Point filter.
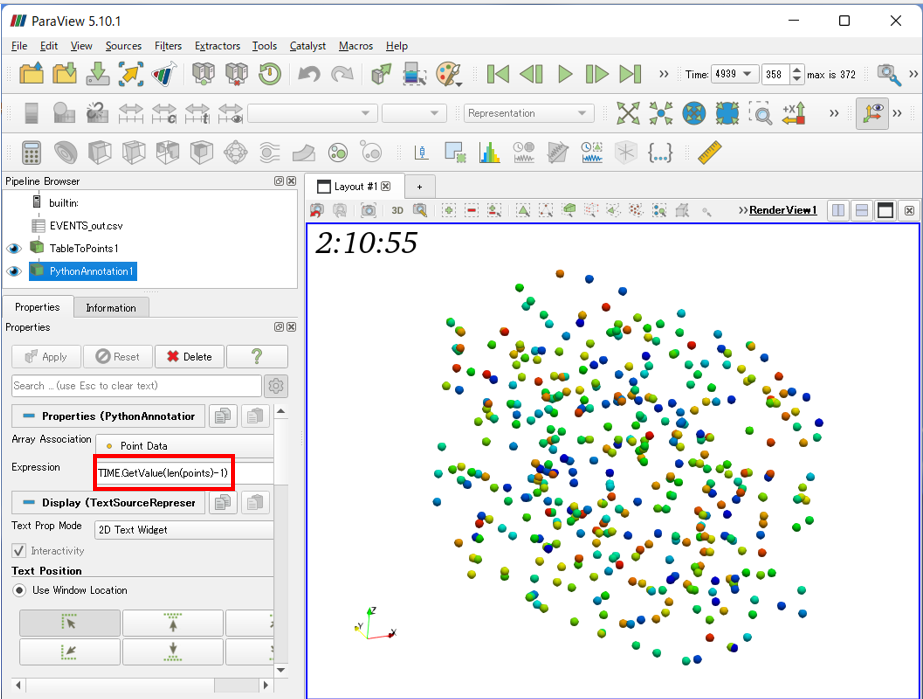
Finally, you may want to use the Python Annotation filter to display the time in the TIME column. Here, Expression is described as follows: Expression: TIME.GetValue(len(points)-1)