Hello guys,
I used ParaView ver 5.9 on the cavity and I got a U magnitude visualization on ParaView, please see the image below.
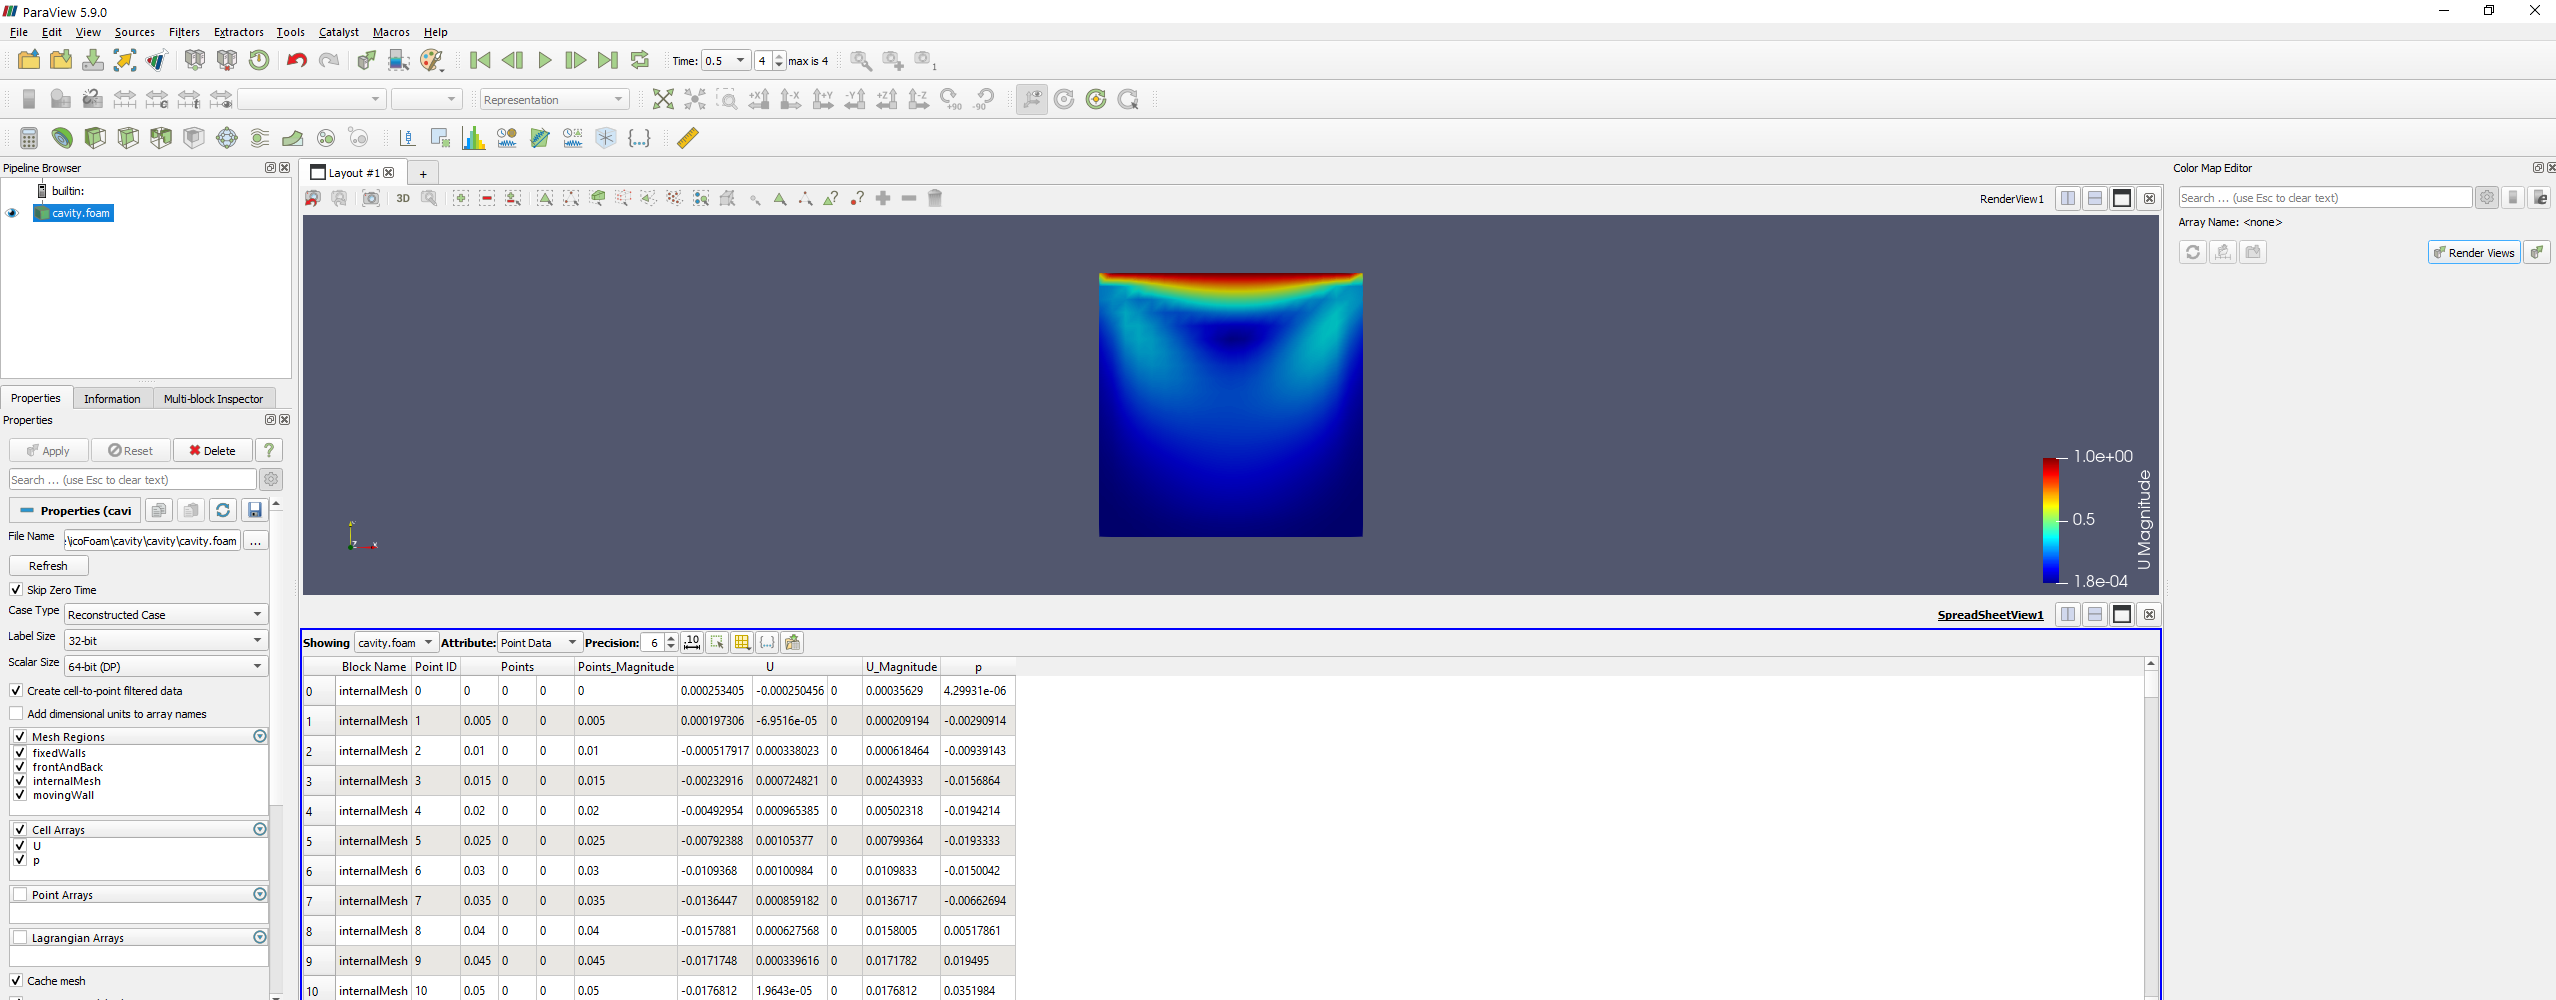
I need to store this U Magnitude data as a data matrix (2D or 3D), then this data will be used in python code to plot this magnitude again to see the result of the U figure.
How do I store the U data on the Paraview and after that I will use a python script code that can process that matrix data to obtain a U image that magnitude color range same on Paraview result?
I am looking any your help.
Many thanks.