we (at Kitware Europe) are currently developing a ParaView plugin designed for acoustic visualization and post-processing, and we’re trying to gather feedbacks and feature requests around this field so that this plugin can be useful for everyone out of the box.
Currently the state of this work is :
Merged into VTK / ParaView :
the vtkFFT class for doing fft, rfft, irfft, etc. It uses the kissfft library.
a better vtkTableFFT filter that uses the new vtkFFT class. Supports :
FFT per block in order to speed up the processing on large signals
windowing function (Hanning, Bartlett, Sine and Blackmann )
an octave-band / fractional-octave-band filtering VTK filter
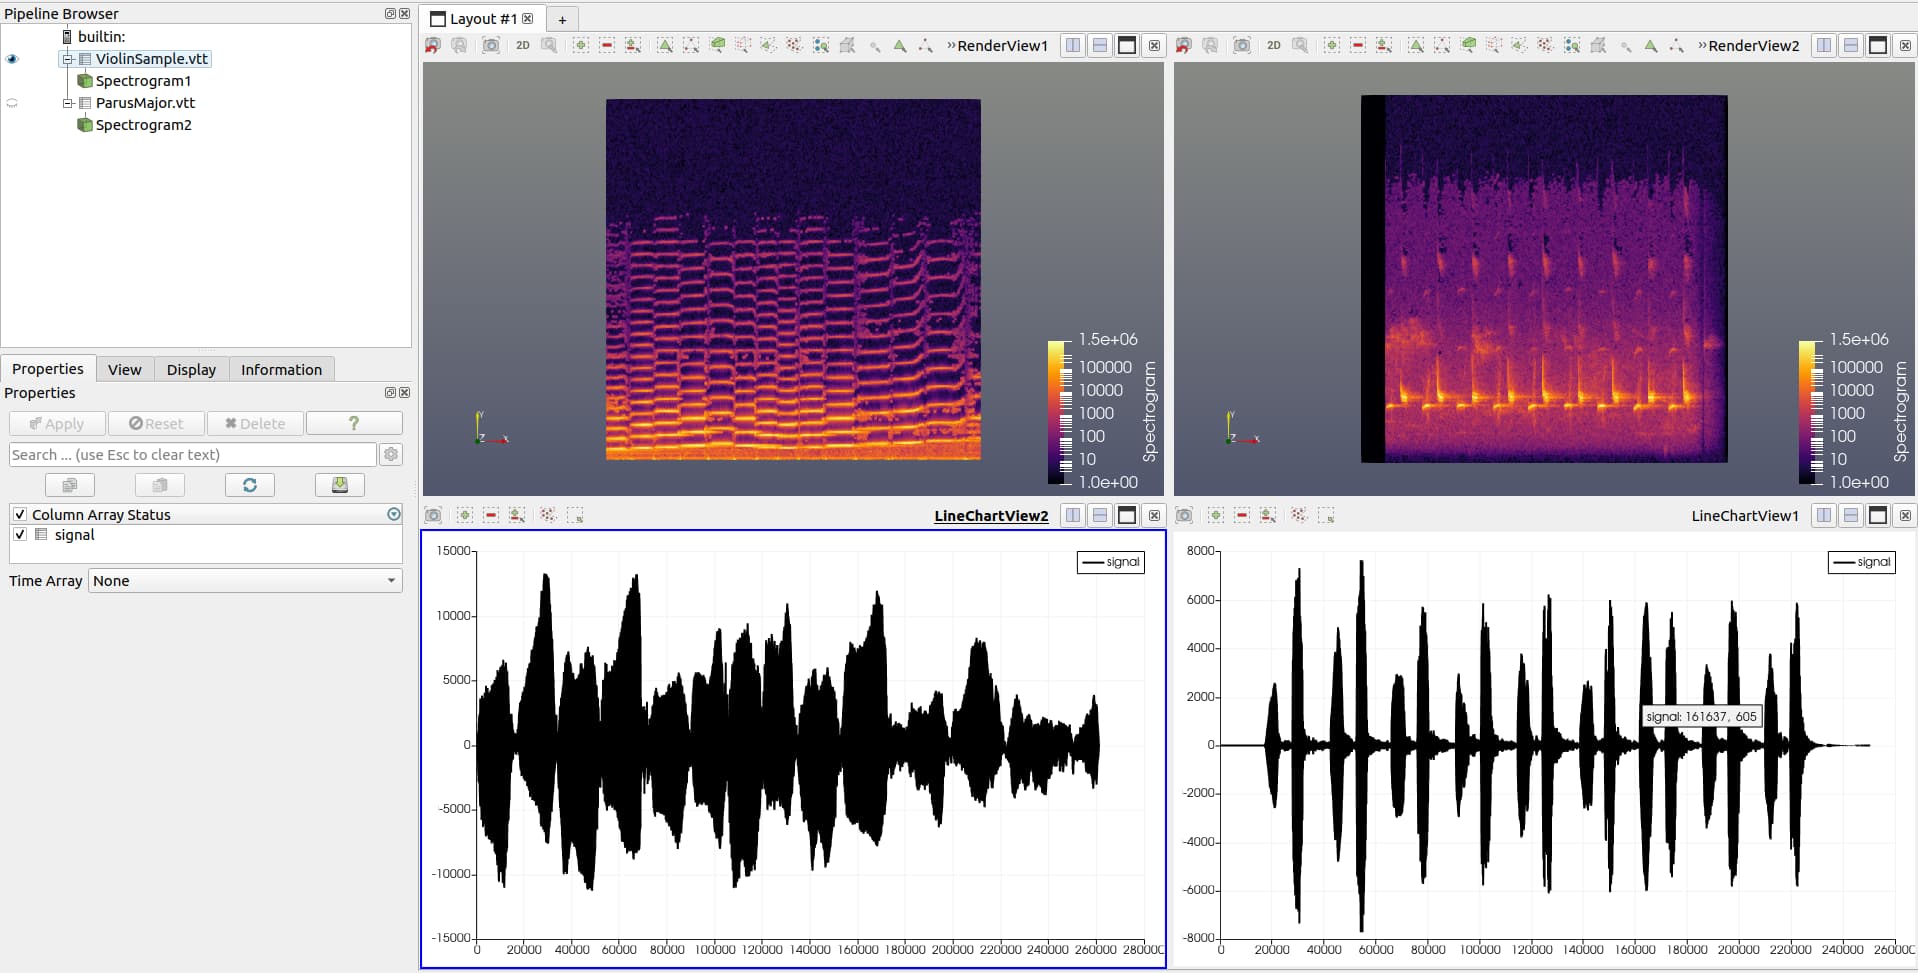
a spectrogram filter (see below for a screenshot of the results)
a filter to compute some useful metrics over a mesh or a signal, such as :
the pressure RMS value in Pa and dB
the accoustic power
the power spectral density
Future work :
being able to actually listen to an audio signal (which will be a vtkTable with a column representing the actual signal) directly within ParaView.
integration of all mentioned VTK filters into ParaView
We’d like to know if any of this feature looks exciting to you, or if there’s a missing feature that you’d love to see in ParaView Please let us know !
Hi there, this looks like a really interesting feature! I’ve got a potential use case: in our research, we’ve explored using spectrograms for sonifying CFD datasets of aneurysm fluid flow, because in experimental studies, aneurysm have been observed to emit “bruits” (sounds). So we wanted to listen to our datasets, analogous to medical auscultation.
A few years ago, I built a prototype tool linking the ParaView python shell to a SuperCollider sound server that would:
Let a user drag an interactive probe around the dataset in ParaView
Query the mesh in ParaView for points within the probe radius
Return the time-varying array data associated with those points
Create an average spectrogram of that data
Visualize the spectrogram
Sonify the spectrogram using SuperCollider
To get it to run in real-time over an entire dataset (hundreds of thousands to millions of points, thousands of timepoints) with my limited ParaView knowledge, I used the point IDs from ParaView to query a memory-mapped h5 array of the data (where rows were indexed by point IDs, columns were time points) rather than stepping through time and retrieving data within ParaView.
This proposed feature sounds really exciting, so I just wanted to share my experience I think visualizing and sonifying region-averaged spectrograms would be really useful, especially if that could be done interactively with filtering and EQ capabilities.
thanks for your feedback ! This workflow looks really interesting, and it’s usefull to know that some people other than pure acoustician want to “hear” their data. Also I understant why you queried the time-varying data using a memory-mapped h5 array. AFAIK VTK is not very efficient to retrieve a specific subset of data for all timesteps.
This is very interesting. We are using VTK and Paraview to post-process and visualize results from our aeroacoustic CFD solver MGLET. This is a block-structured LES code that solve the incompressible flow and acoustics. With this we can predict noise from turbulent flows.
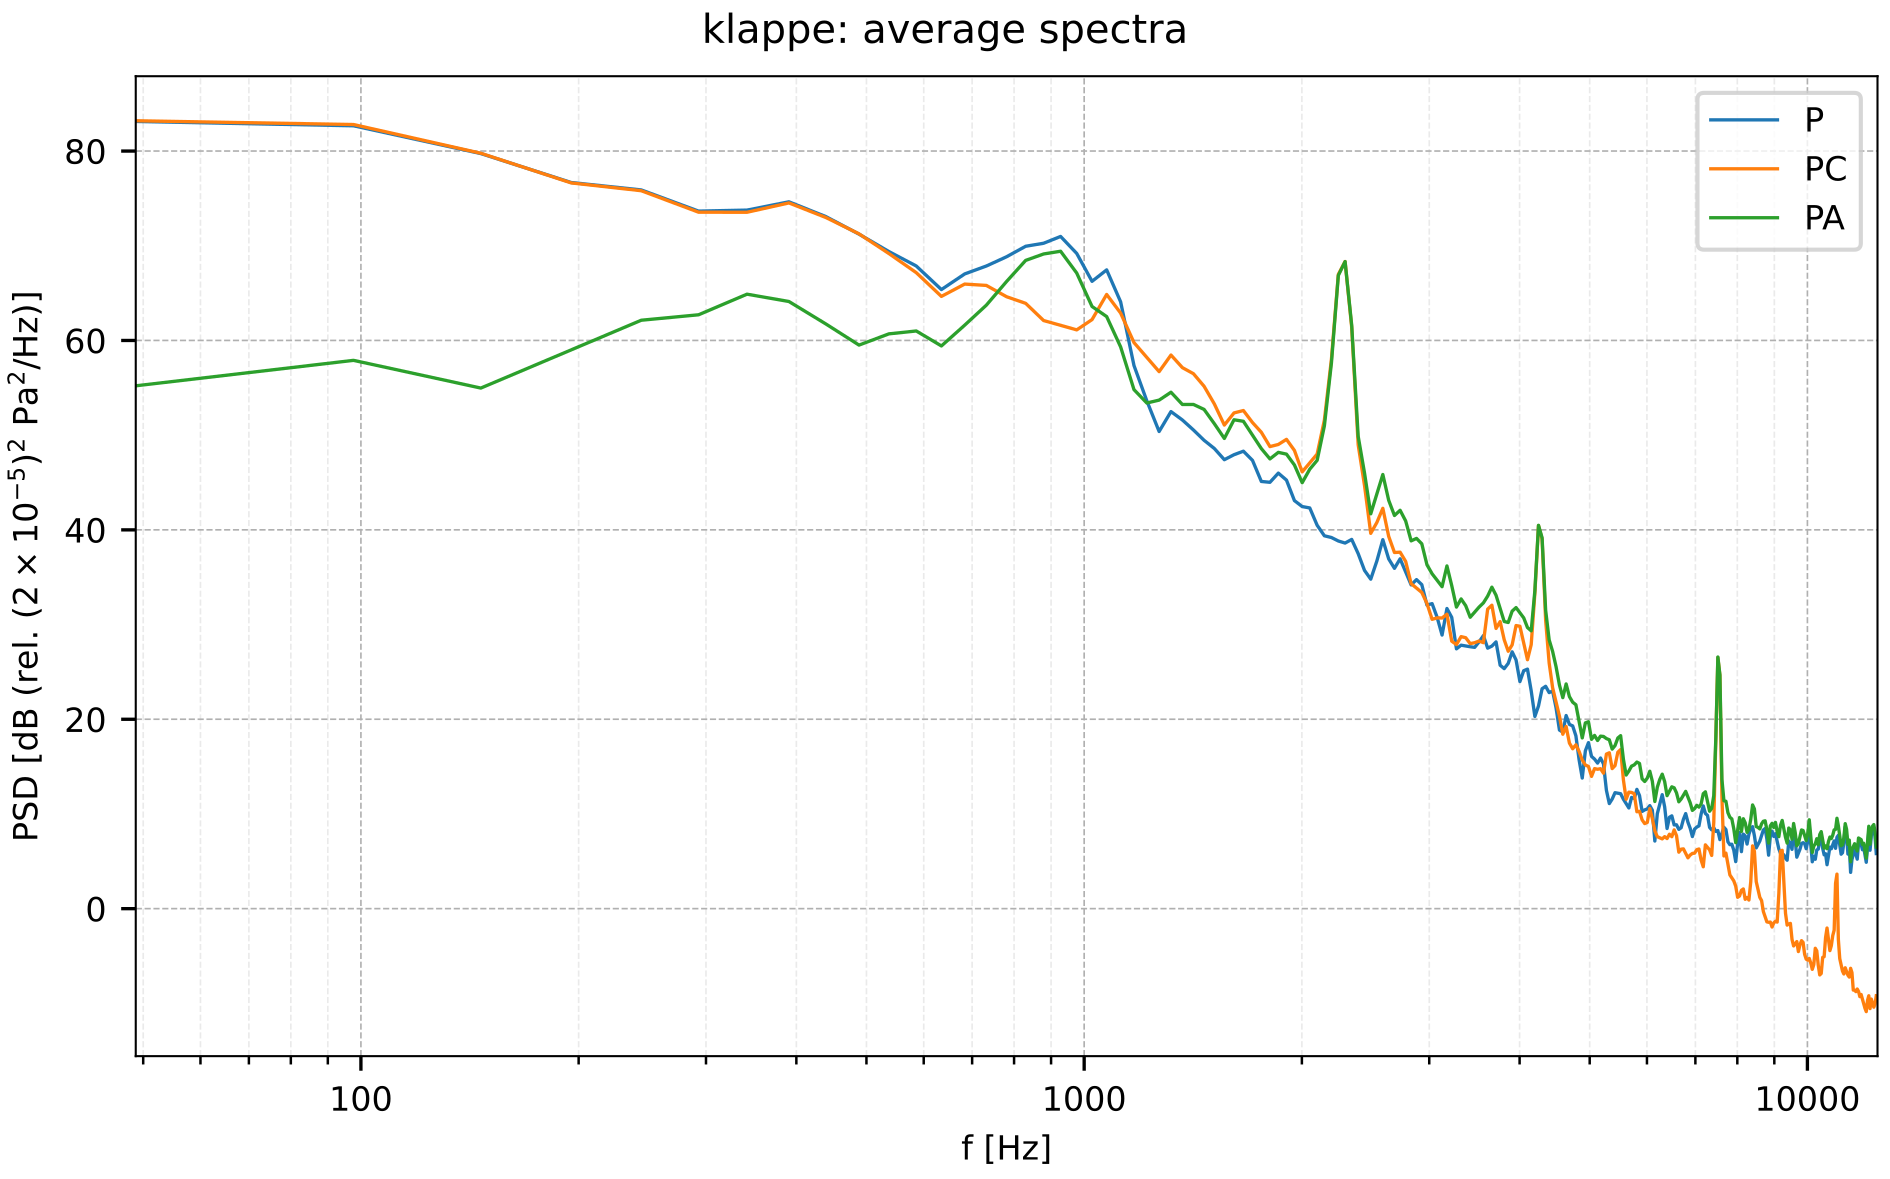
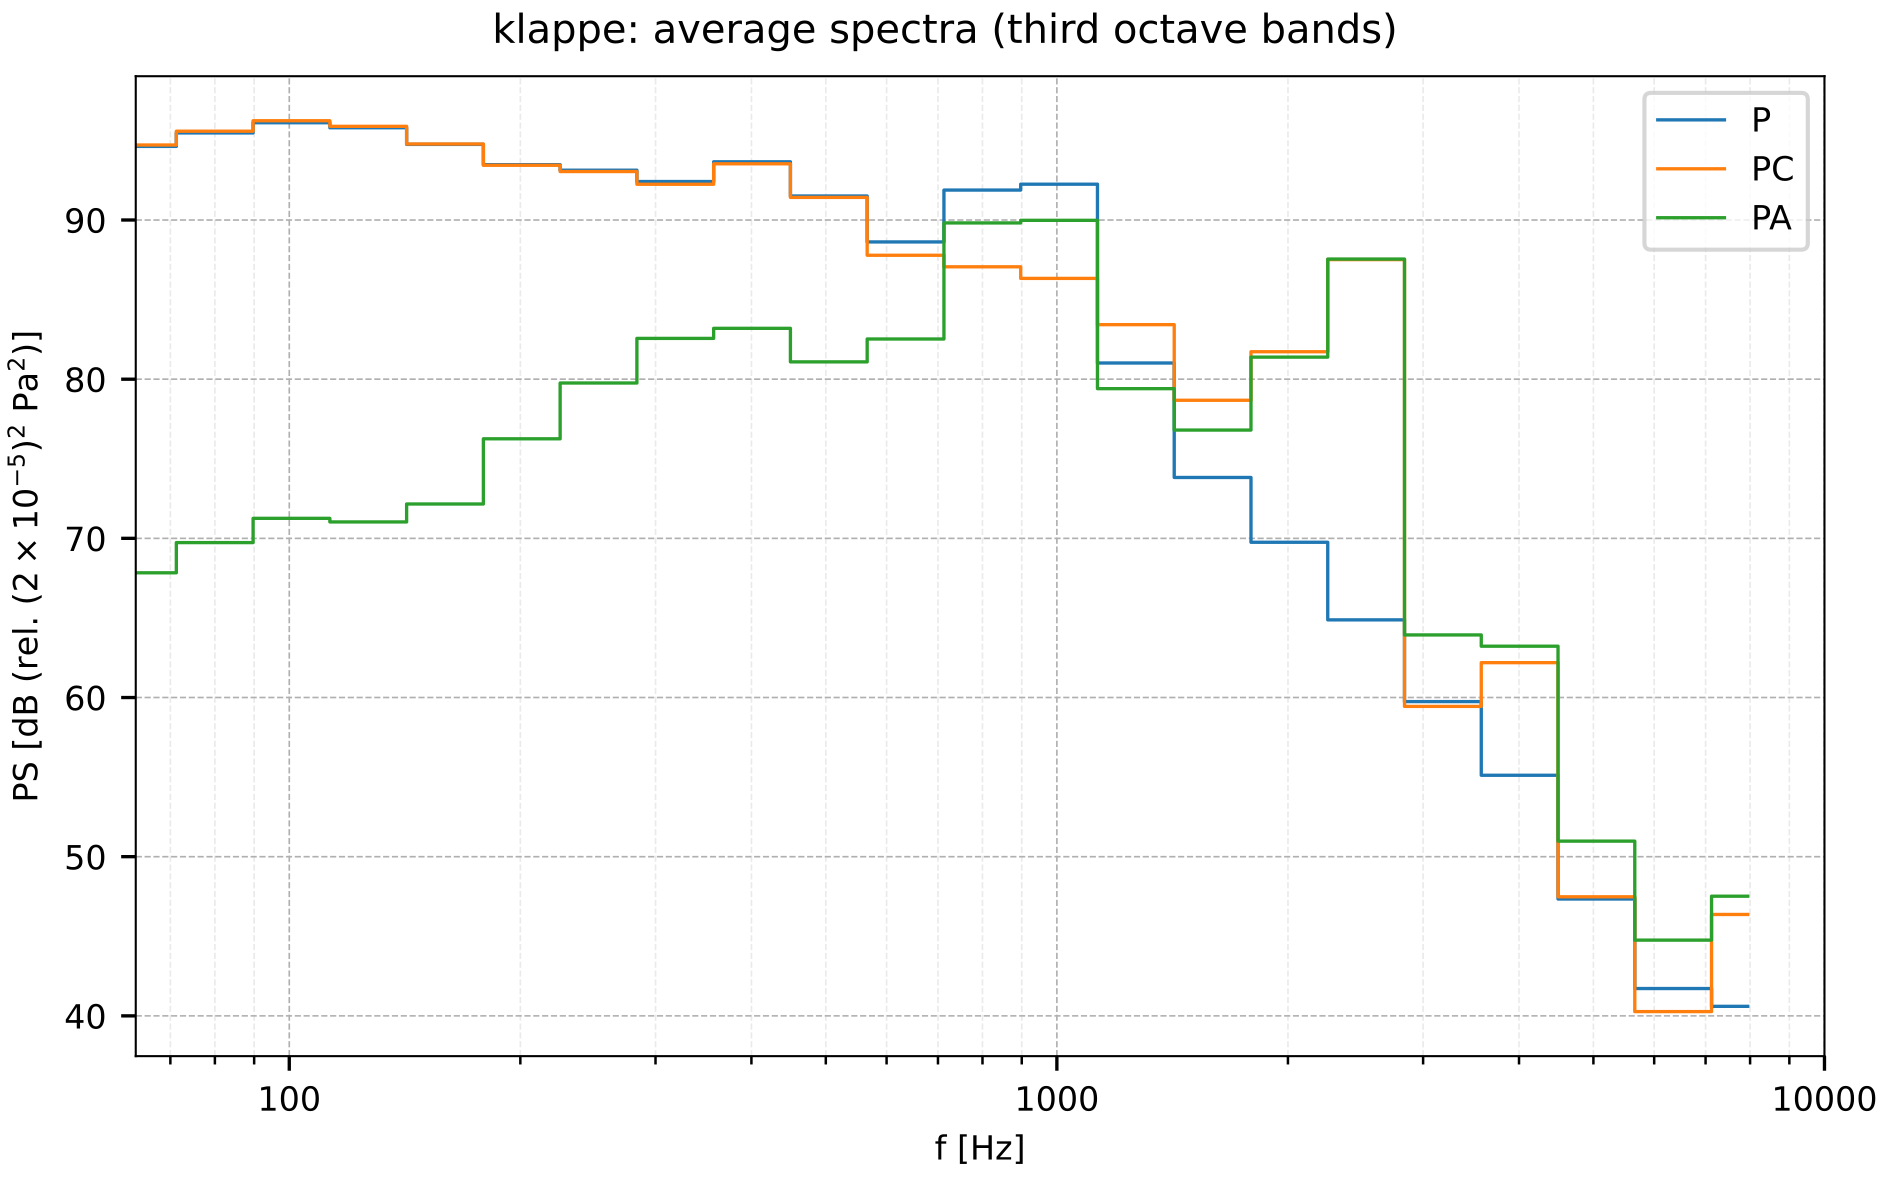
Currently we use VTK and Paraview for 3-D (volumetric) datafields. Users typically also insert various probe arrays in the simulations, from which timeseries of various quantities can be extracted (incompressible pressure, compressible pressure, flow- and acoustic velocities). From this data we generate spectra of various kinds. From our simulations the users can insert probe arrays that evaluate both ordinary sound pressure (in Pascal) and sound power integrated over a control surface (in Watt). This process is however, entirely independent of VTK.
Here is an example of an output of such a spectra:
Another interesting feature where we do not yet manage to unleash the complete potential is surface sampling. On the surface of the geometries we are simulating we can choose to save quantities such as pressure and wall-shear stress during the simulation. This allows for creating visualizations like this one of wallshearstress or this one with acoustic pressure to the left and wallshearstress to the right (both animations are better if you save them locally before viewing). These animations are created by converting MGLET’s native HDF5-based format(s) to VTP before opening in Paraview and creating the animation.
With this data existing in both space and time, it would be awesome to utilize Paraview to interactively explore the contents of these signals in frequency space. I could for instance both imagine being able to select individual points om the surface (with an ordinary selection tool) and compute the spectra of this point, and being able to compute the spectra of every point and visualize this is 3-D space for a specific frequency. In both cases I think that Paraview and VTK would struggle due to poor support for time-dependent data (in order to read out a timeseries from a surface, you need to open every VTP file in the timeseries etc.). Such a use-case is very similar to the feature @demacdo explained a few posts above.
The spectrogram is obviously also nice, and I will try it out as soon as it’s available in a nightly build.
All in all I’m very delighted to see this support in VTK/Paraview because it means that we are not the only ones working with acoustics with these tools!
Thanks for your feedback ! That is very encouraging as most of what you’re showing here is intended to be developed and exposed (integrated acoustic power and PSD, band-filtering, 3D visualisation of such mesurements, etc) !
One of our issue is indeed how to represent temporal datasets so they can be efficiently processed further on. What we ended up with is a multiblock of vtkTable, with each block representing a point in the input mesh, and each column of the tables representing a time-varying data array. Actually you can currently obtain this structure using the Plot Data Over Time filter in ParaView with the option Only Reports Selection Statistics unchecked. We still need to read every files at least once but at least all data are loaded and time-varying data is contiguous in memory. For filters that needs both the time-varying data arrays and the topology (to compute acoustic power integrated over a surface for example) we use 2 inputs : one is the multiblock of vtktable and the other is the mesh. That works under the assumption that the input mesh topology does not change over time.
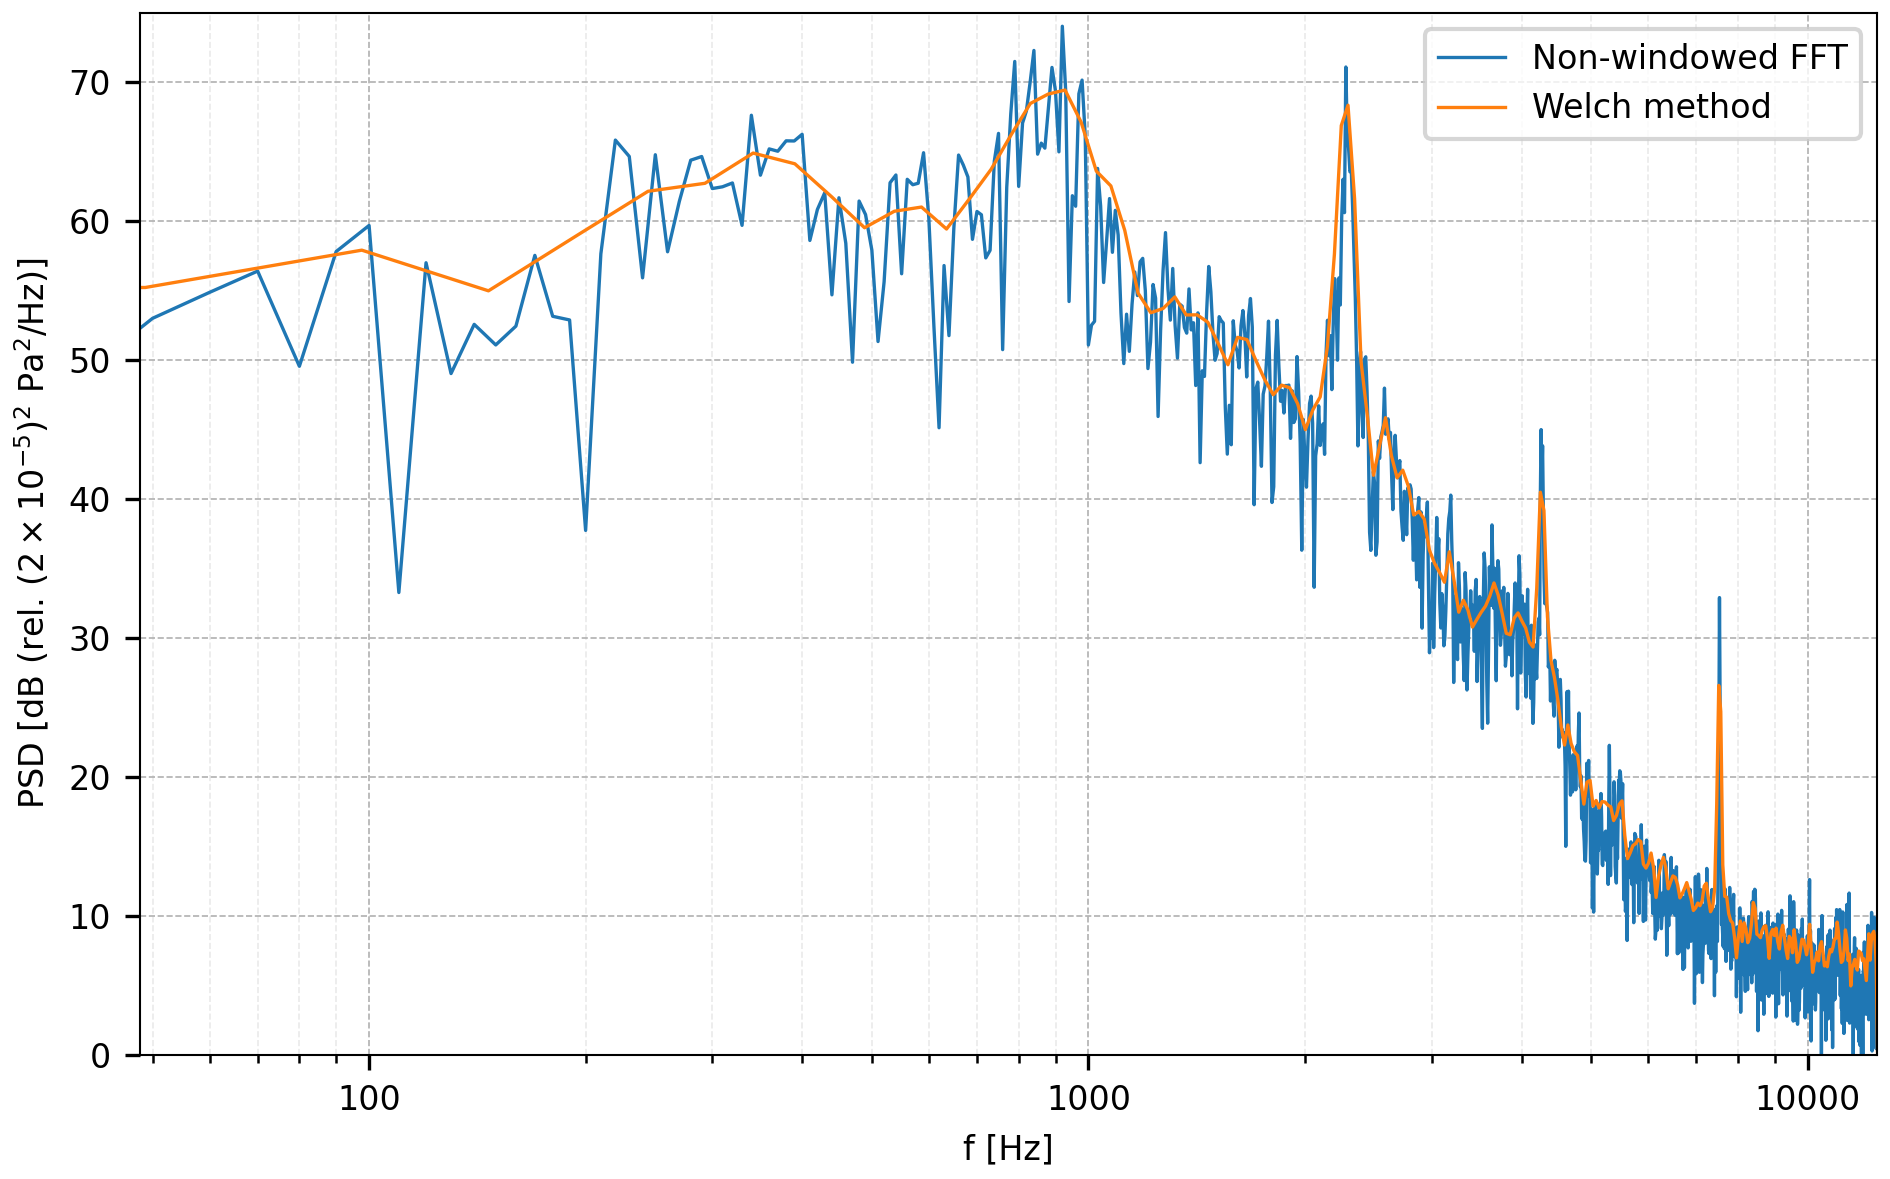
Another detail that came to my mind is that a good method to generate a PSD is required for acoustic analysis. It is essential to apply the Welch method, which is basically chopping up the input signal in several smaller pieces (possibly overlapping), apply a window, compute the spectra of each individual piece and then average all of these spectra in the end. This sacrifice frequency resolution in favor of noise. The implementation we use is scipy.signal.welch which is extremely convenient and easy to use, because all the detrending, chopping, input preparations, windowing and scaling to a PSD in the end is done automatically in a single call:
f, psd = signal.welch(probe, fs=fs, nperseg=nfft)
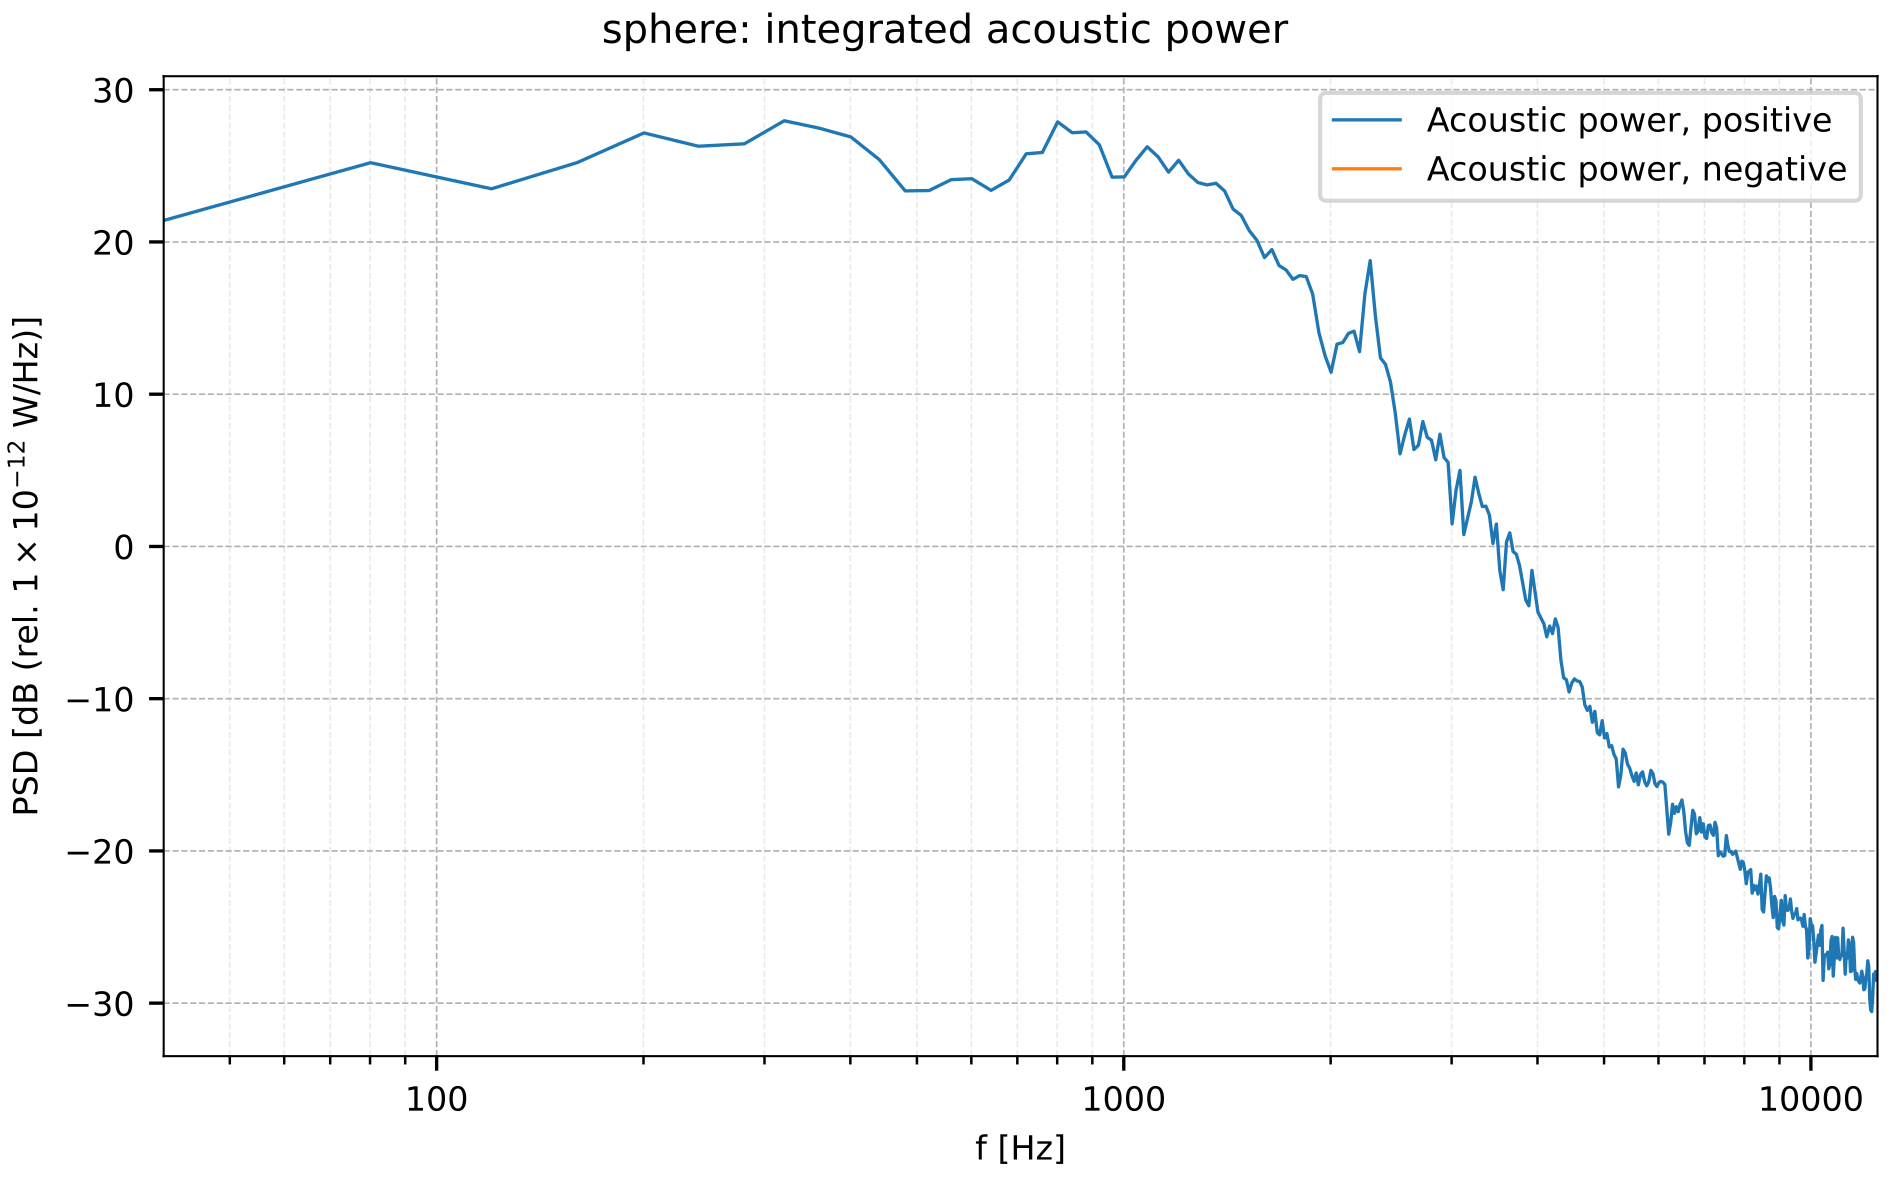
Here is an example with a non-windowed FFT approach (just putting the entire input signal in an FFT and converting to a PSD) and the windowing/Welch method:
Here the orange curve is a lot easier to interpret than the blue.
I looked into vtkTableFFT and it seems to have some kind ow windowing support, but did not yet look into the details. I will for sure compare my scipy.signal.welch spectra with the one I can get from vtkTableFFT.
I don’t know if it is exaclty the Welch algorithm but note that vtkTableFFT already supports windowing and chopping the signal into smaller pieces. See vtkTableFFT::SetAverageFft, vtkTableFFT::SetNumberOfBlocks and vtkTableFFT::SetBlockSize. It is not nearly as simple to use as scipy.signal.welch but it should work as expected.
Now I’m starting to use this post as support, please let me know if I should discuss this in a separate post instead.
I would like to make myself a comparison between scipy.signal.welch and vtkTableFFT to see if I can utilize VTK to create the same spectra. However, my first try with vtkTableFFT failed:
import numpy as np
import vtk
from vtk.util import numpy_support as nps

# Generate time and some signal
time = np.linspace(0.0, 1.0, num=10001)
signal = np.random.default_rng().random(time.shape)

time_arr = nps.numpy_to_vtk(time, deep=1)
time_arr.SetName("Time")

signal_arr = nps.numpy_to_vtk(signal, deep=1)
signal_arr.SetName("Signal")

table = vtk.vtkTable()
table.AddColumn(time_arr)
table.AddColumn(signal_arr)

fft = vtk.vtkTableFFT()
fft.SetInputData(table)
fft.OptimizeForRealInputOn()
fft.CreateFrequencyColumnOn()
fft.SetWindowingFunction(vtk.vtkTableFFT.HANNING)
fft.SetAverageFft(True)
#fft.AverageFftOn()
fft.SetBlockSize(512)
fft.NormalizeOn()
fft.Update()
result = fft.GetOutput()

print(fft)
print(result)

f_vtk = nps.vtk_to_numpy(result.GetColumnByName("Frequency"))
print(f"Number of frequencies: {f_vtk.shape}")
results in the following output:
vtkTableFFT (0x1991eb0)
  Debug: Off
  Modified Time: 164
  Reference Count: 2
  Registered Events: (none)
  Executive: 0x19933c0
  ErrorCode: Success
  Information: 0x1992050
  AbortExecute: Off
  Progress: 1
  Progress Text: (None)
  AverageFft: 0
  Normalize: 1
  OptimizeForRealInput: 1
  NumberOfBlock: 2
  BlockSize: 512
  WindowingFunction: 0


vtkTable (0x1994680)
  Debug: Off
  Modified Time: 287
  Reference Count: 2
  Registered Events: (none)
  Information: 0x1993dd0
  Data Released: False
  Global Release Data: Off
  UpdateTime: 302
  Field Data:
    Debug: Off
    Modified Time: 281
    Reference Count: 1
    Registered Events: (none)
    Number Of Arrays: 0
    Number Of Components: 0
    Number Of Tuples: 0
  RowData:
    Debug: Off
    Modified Time: 301
    Reference Count: 1
    Registered Events: (none)
    Number Of Arrays: 2
    Array 0 name = FFT_Signal
    Array 1 name = Frequency
    Number Of Components: 2
    Number Of Tuples: 5001
    Copy Tuple Flags: ( 1 1 1 1 1 0 1 1 1 1 1 )
    Interpolate Flags: ( 1 1 1 1 1 0 0 1 1 1 1 )
    Pass Through Flags: ( 1 1 1 1 1 1 1 1 1 1 1 )
    Scalars: (none)
    Vectors: (none)
    Normals: (none)
    TCoords: (none)
    Tensors: (none)
    GlobalIds: (none)
    PedigreeIds: (none)
    EdgeFlag: (none)
    Tangents: (none)
    RationalWeights: (none)
    HigherOrderDegrees: (none)


Number of frequencies: (5001,)
I tried both fft.SetAverageFft(True) and AverageFftOn(). Yet print(fft) still prints AverageFft: 0, and it is evident from the number of frequencies in the result that there is no windowing going on. From a window size of 512 i would expect 512/2+1=257 frequencies. Is averaging the same as windowing in Welch’s method?? If this is a bug I can submit an issue.
I’m also a bit disappointed over the online documentation for vtkTableFFT. There are very little description, and the parameters in the online docs are only described for their corresponding Get methods, i.e. for example SetBlockSize does not have a documentation. Some options, like Normalize is completely undocumented (neither SetNormalize, NormalizeOn nor NormalizeOff has any documentation), so this feature does what??? I really needed to look into the C++ sources to use this, and still I don’t understand the implementation and how to get the results I want.
Ok so currently there is indeed several problems :
documentation is not enough explenatory and ill-formed, this is why there only documentation for getters.
the AverageFft parameter was never set, resulting in ignoring the BlockSize and BlockNumber parameters.
I’ll soon fix this so it can work as expected (see explanation below).
Let me explain the options a bit, so you can tell me if some names should be changed or if parameters should be added/removed to the API :
OptimizeForRealInput : basically it switches between using scipy.signals.fft and scipy.signals.rfft. This has an incidence on the output size (output size for real input is ~ half the size).
WindowingFunction : the windowing kernel to use. A kernel of the size of the input signal is generated and applied before doing the FFT.
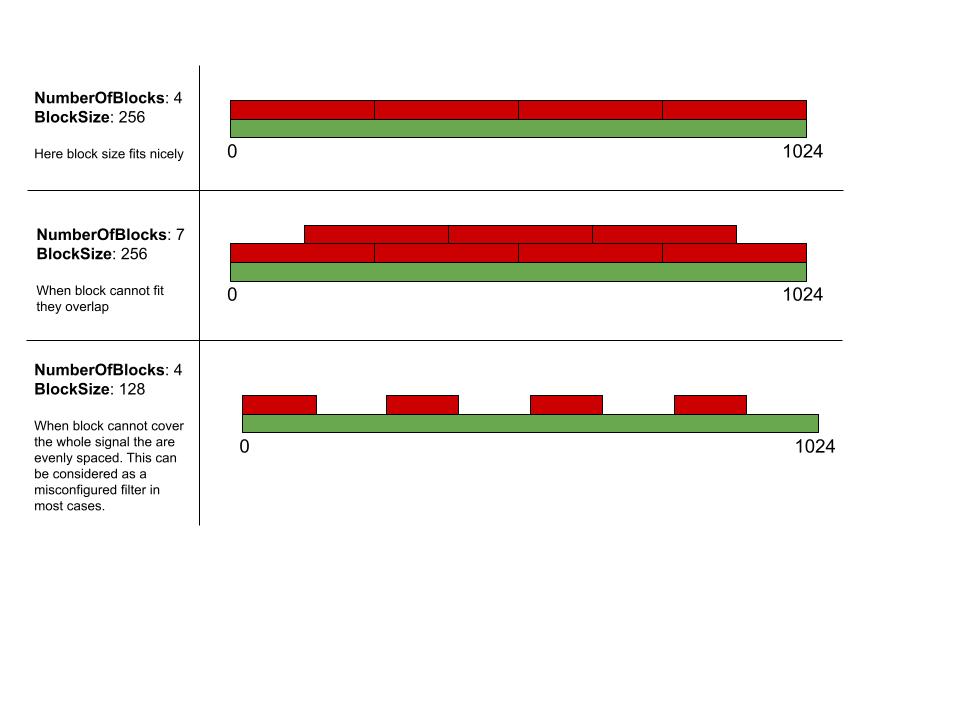
Average FFT per block : when off the filter computes a single FFT on the whole signal. If the signal is big this can take some time. To allow for a bit less precise FFT but much shorter computation time, one can average the FFT turning this option On. The algorithm when averaging the FFT is controlled by two other parameters : NumberOfBlocks and BlockSize. The algorithm is doing the following :
Create a windowing kernel of size BlockSize (or half of it if OptimizeForRealInput is on)
Extract the first BlockSize samples of the input signal
Apply the windowing kernel and then the FFT to it. The resulting FFT is of size BlockSize (or half of it if OptimizeForRealInput is on)
Store this FFT in a buffer
Repeat the process NumberOfBlocks times from step 2. but shifting the starting point when extracting the samples. The idea is that the block is “sliding” from start to finish. See below for an explanation of how the shift occurs. Green is the input signal and red are the block extracted
Once all blocks are extracted, average them all and return this result.
Normalize : this parameter has 2 effects. First it transform the imaginary output of the FFT as a real output representing of the norm of all imaginary values and also divide it by the Windowing kernel energy. Second it removes the mean signal of each block before doing the FFT. For example on a pure sinusoidal signal the mean is 0 so it will have no effect.
The overall algorithm has been crafted with people from the acoustic world, maybe it is different from welch algorithm but it should still be usable (once I correct the bugs ).
Thanks for the explanation, this makes some sense. I also saw that you pushed some changes in the vtkBandFiltering-MR, thanks.
I built the last version of the band-filtering MR and played around with it a bit. Now the averaging works. There are however some things I miss:
Being able to create the PSD right away. See my plots in this post, all but on have units of Pa**2/Hz on the y-axis (and use (2e-5)**2 Pa as reference for the dB’s). This is essential. As far as I see there are no shortcuts for creating this, besides implementing all the correct windowing and scaling manually. Maybe I missed something.
Being able to average several spectra together. This is useful if you have several timeseries (e.g. from several microphones). This could either be a separate flag AverageColumns or a separate filter that average all rows of the results besides the “Frequency” column.
vtkTableFFT will take a table with a column “Time” and an arbitrary amount of other columns, and perform an FFT of every column. This is great when I have probe arrays with dozens of microphones with individual timeseries. vtkBandFiltering will, if I understood correctly, just bandfilter a single specified column at a time. This is slightly inconsistent.
After your explanation, I now understand how the NumberOfBlocks works, but I think that it is an awkward selection choice. I much prefer the scipy.signal.welch choice, where the overlap parameter is given in percent, by default 50%. This is a measure of how much each window overlap the preceding one. With this parameter I can have a fixed set of options (nfft, overlap) for any timeseries length and it will do the same thing. With VTK i must compute a suitable NumberOfBlocks depending on nfft and the timeseries length.
These options should ideally be simple on/off/multiple-choice switches in Paraview in one or several easy-to-use filters if the intention is that users should explore such datasets interactively and on-the-fly.