This is very interesting. We are using VTK and Paraview to post-process and visualize results from our aeroacoustic CFD solver MGLET. This is a block-structured LES code that solve the incompressible flow and acoustics. With this we can predict noise from turbulent flows.
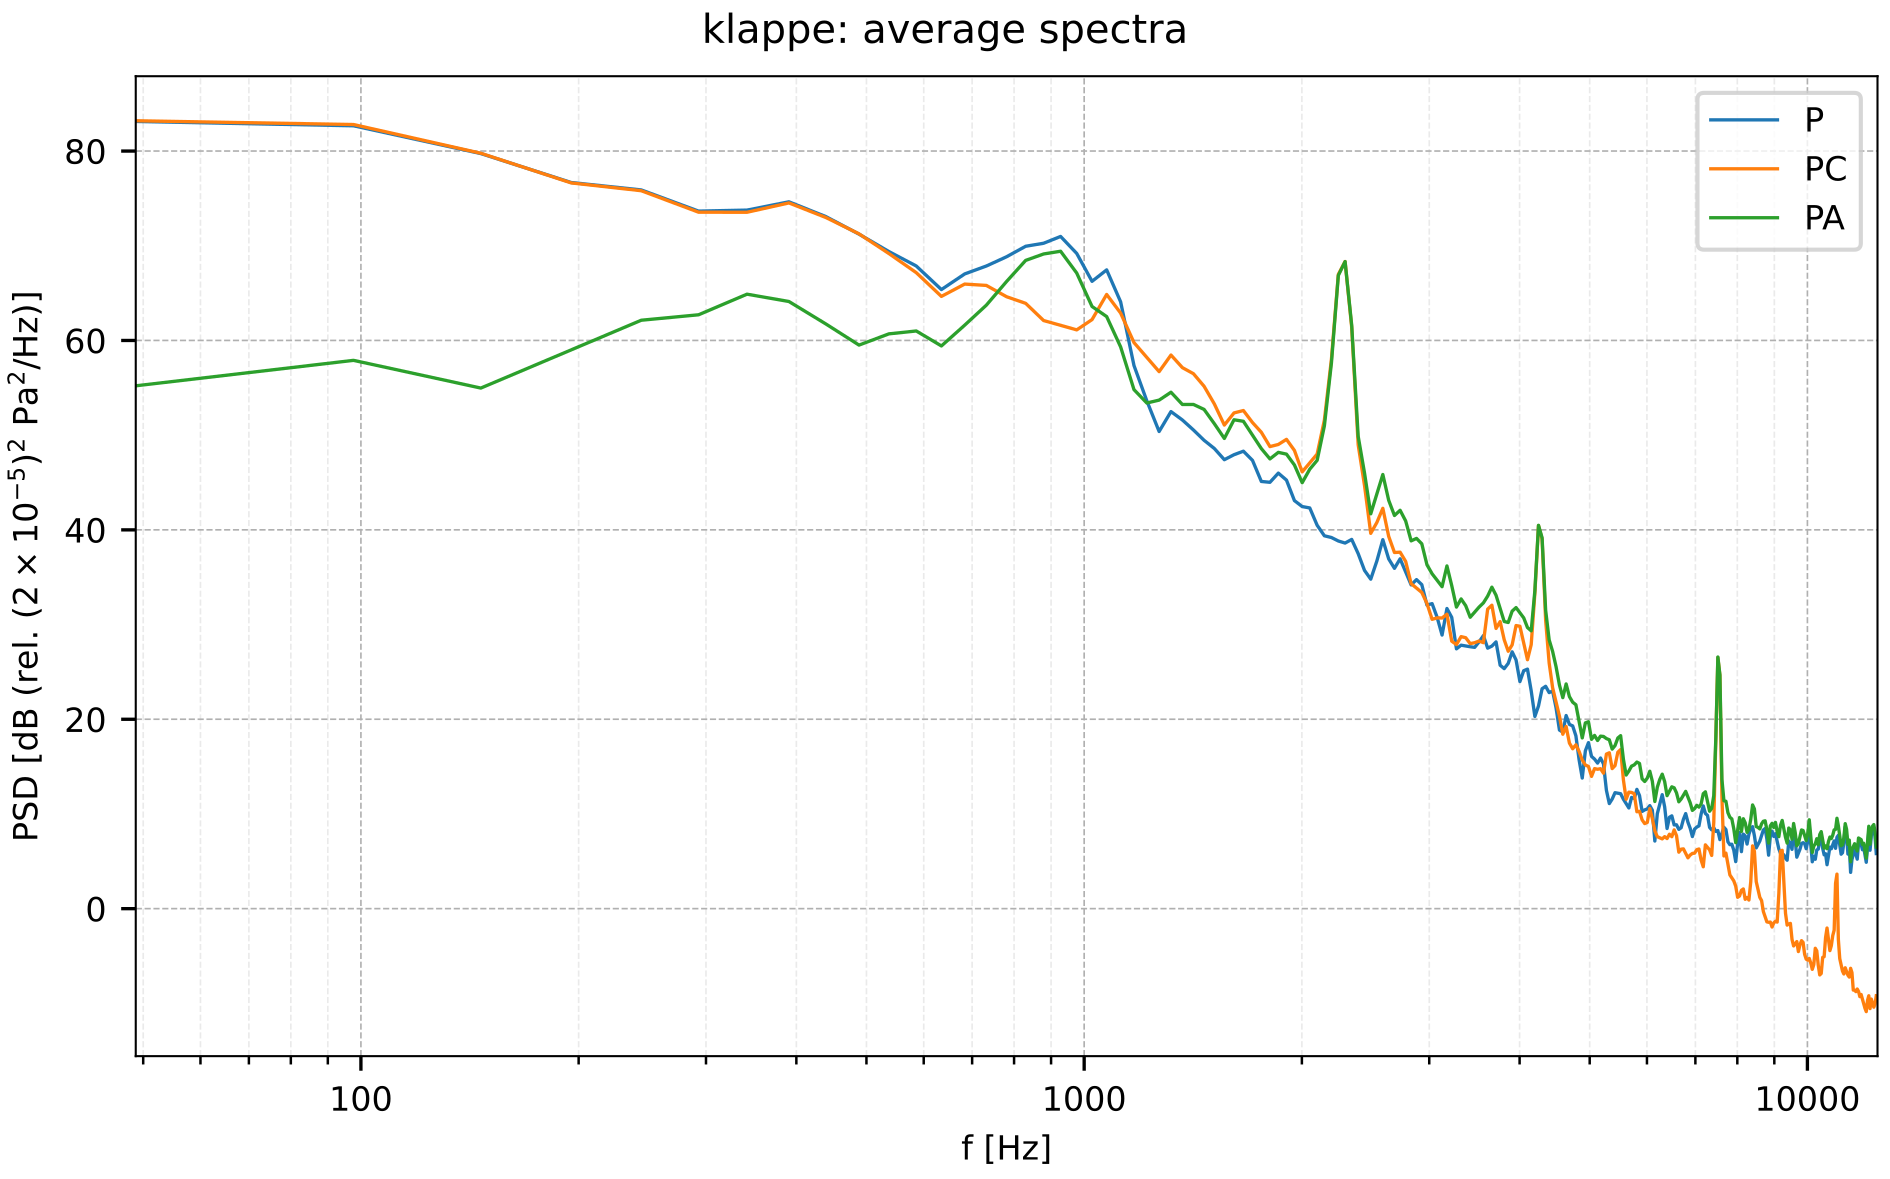
Currently we use VTK and Paraview for 3-D (volumetric) datafields. Users typically also insert various probe arrays in the simulations, from which timeseries of various quantities can be extracted (incompressible pressure, compressible pressure, flow- and acoustic velocities). From this data we generate spectra of various kinds. From our simulations the users can insert probe arrays that evaluate both ordinary sound pressure (in Pascal) and sound power integrated over a control surface (in Watt). This process is however, entirely independent of VTK.
Here is an example of an output of such a spectra:
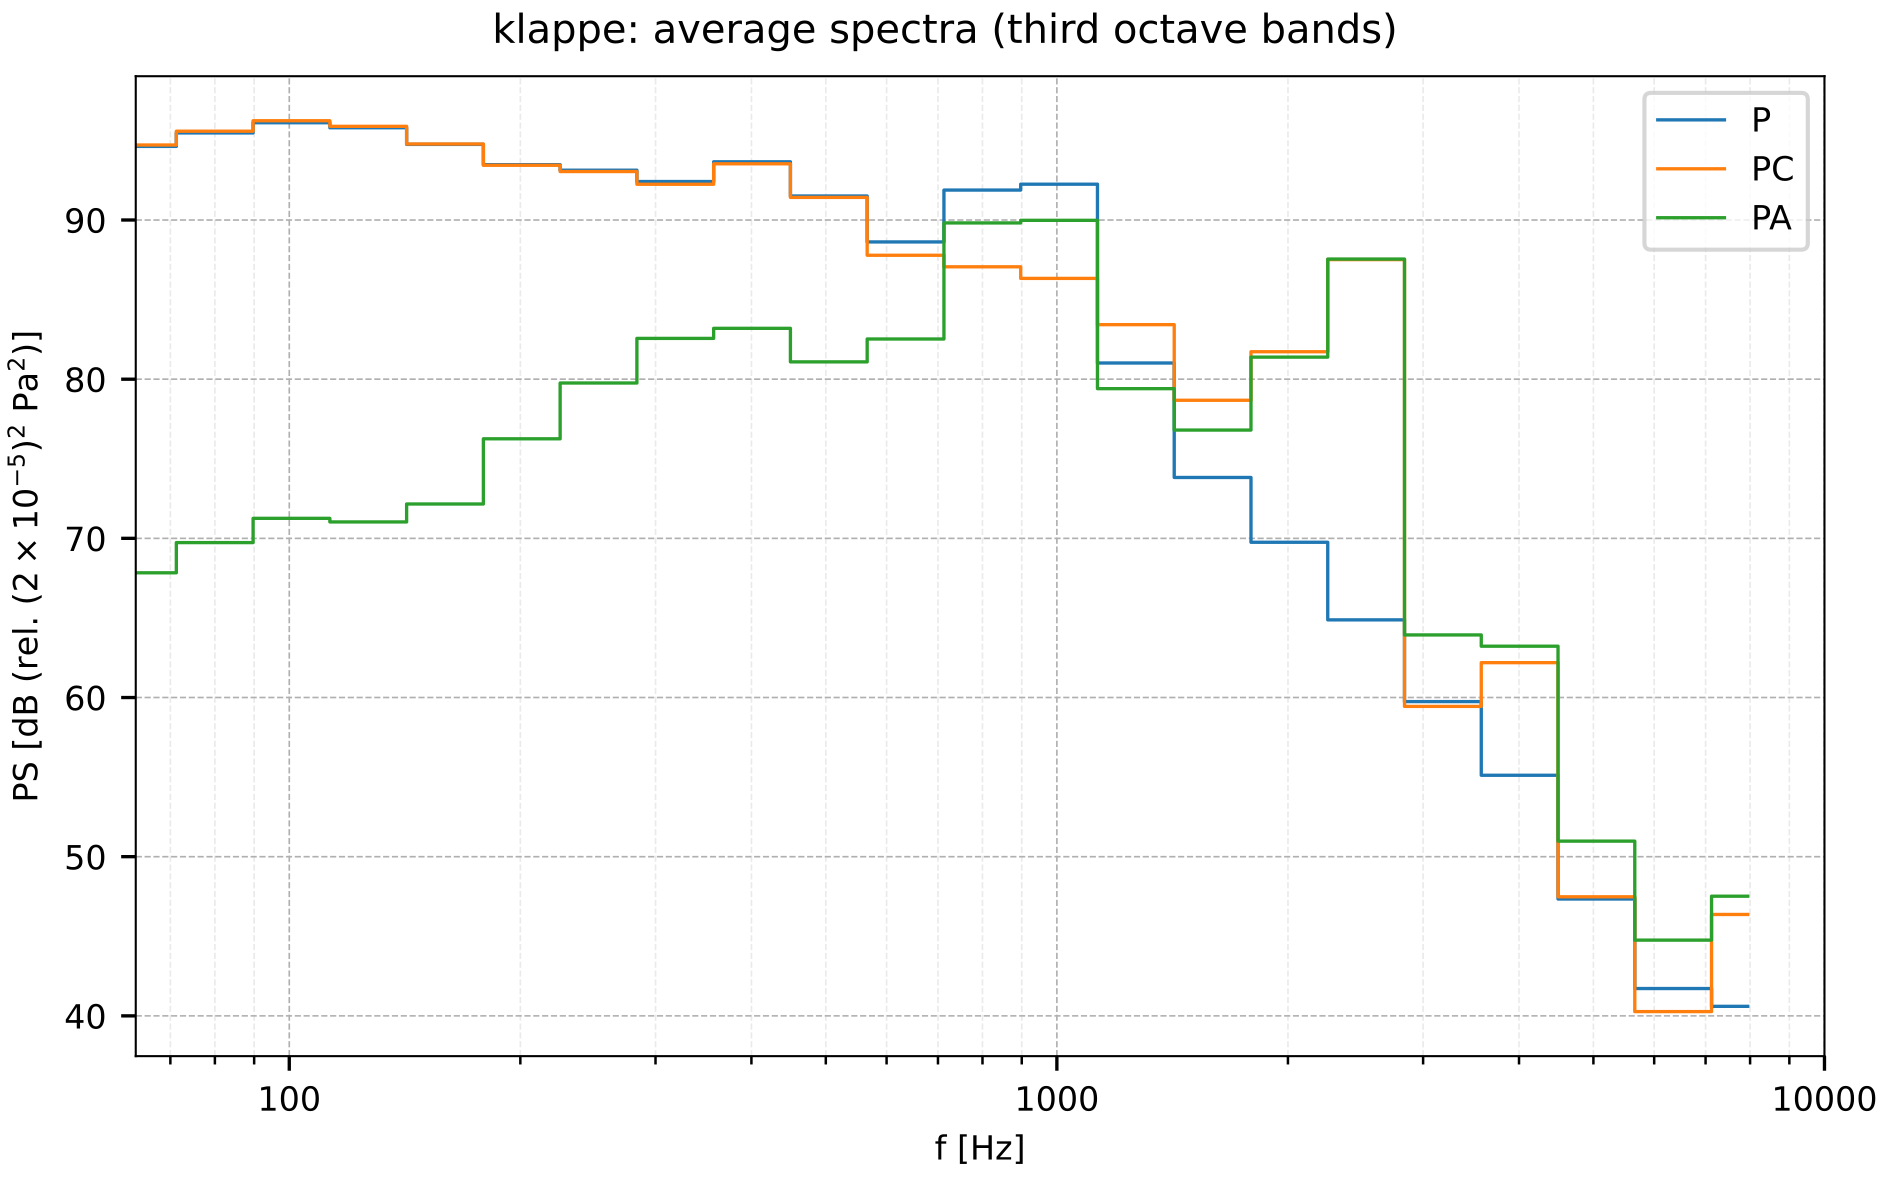
and the corresponding presentation of the third-octave bands:
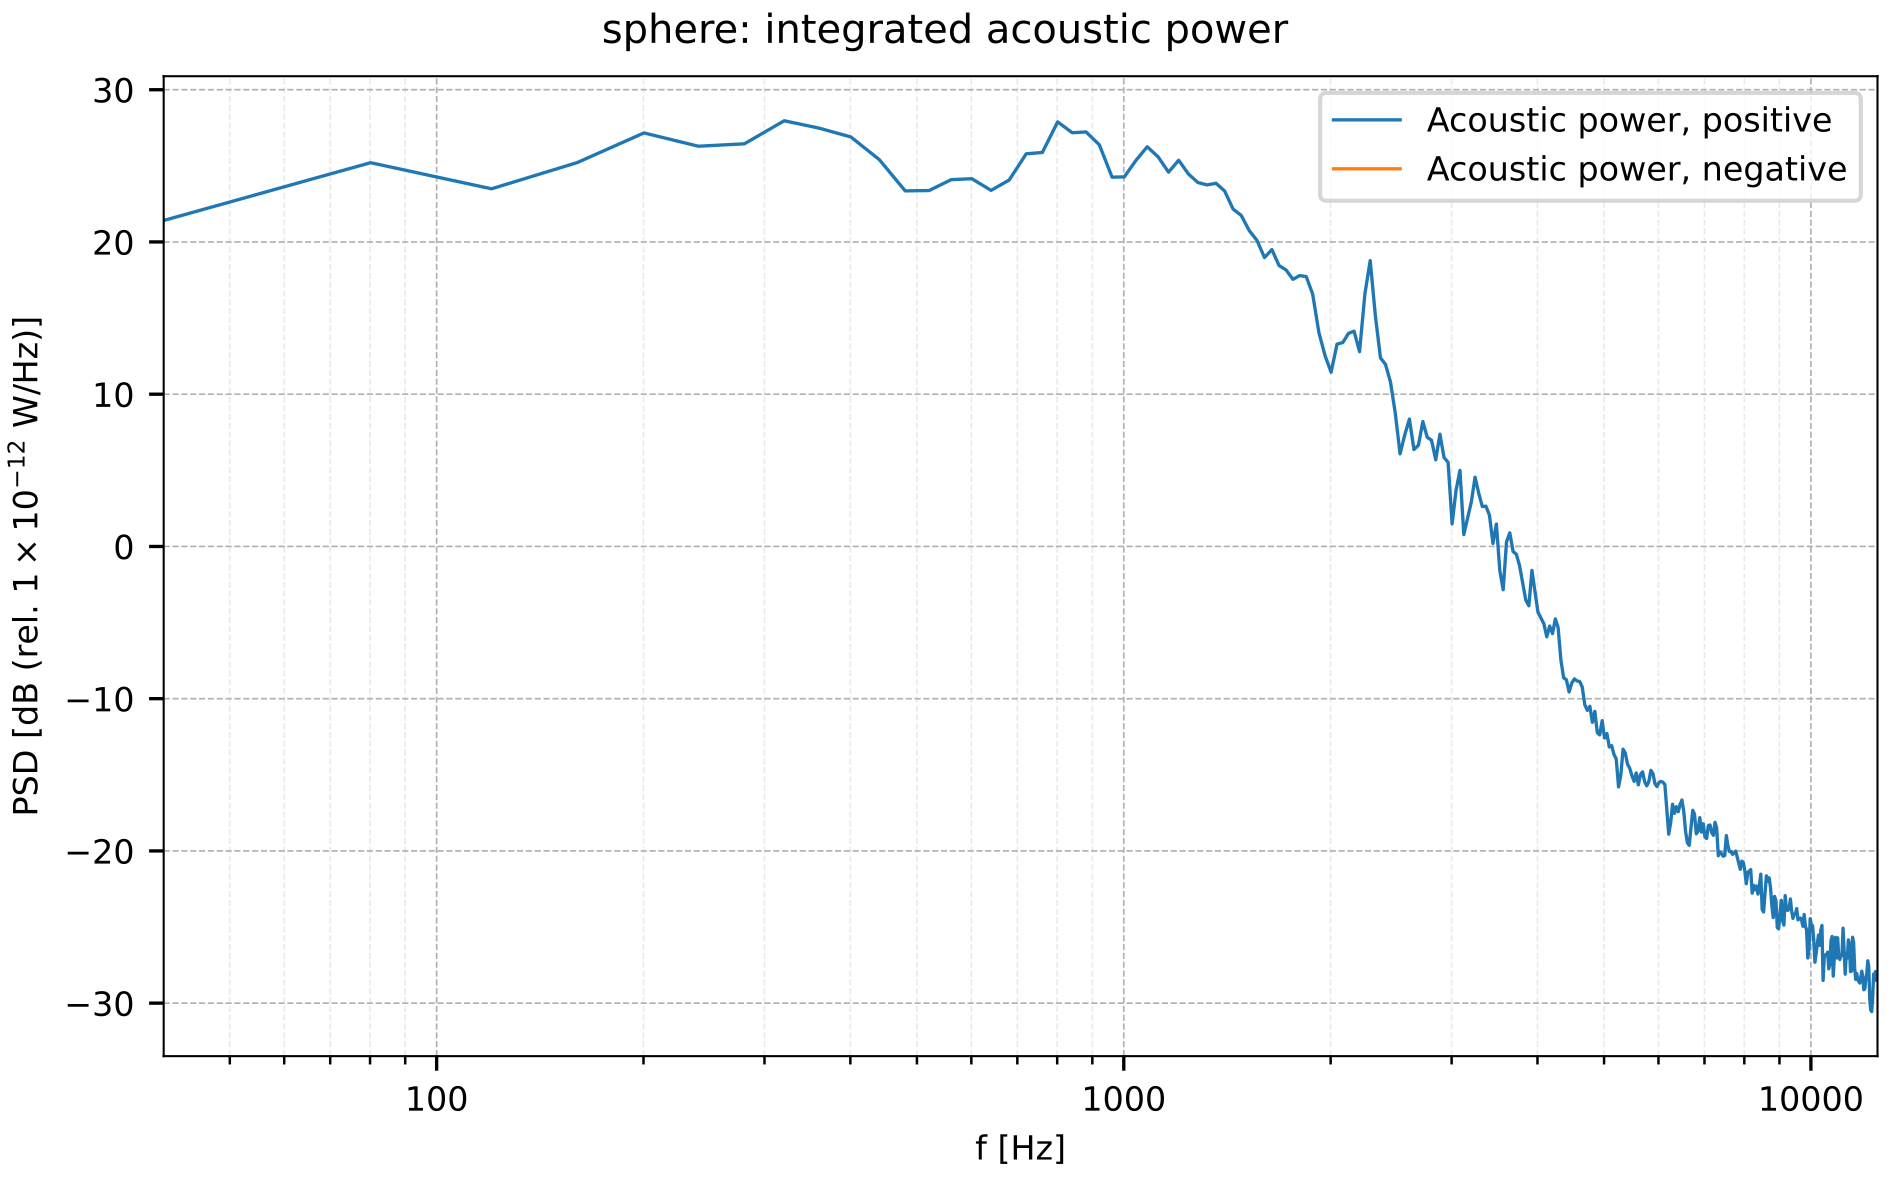
Acoustic power integrated over a control surface:
Another interesting feature where we do not yet manage to unleash the complete potential is surface sampling. On the surface of the geometries we are simulating we can choose to save quantities such as pressure and wall-shear stress during the simulation. This allows for creating visualizations like
this one of wallshearstress or this one with acoustic pressure to the left and wallshearstress to the right (both animations are better if you save them locally before viewing). These animations are created by converting MGLET’s native HDF5-based format(s) to VTP before opening in Paraview and creating the animation.
With this data existing in both space and time, it would be awesome to utilize Paraview to interactively explore the contents of these signals in frequency space. I could for instance both imagine being able to select individual points om the surface (with an ordinary selection tool) and compute the spectra of this point, and being able to compute the spectra of every point and visualize this is 3-D space for a specific frequency. In both cases I think that Paraview and VTK would struggle due to poor support for time-dependent data (in order to read out a timeseries from a surface, you need to open every VTP file in the timeseries etc.). Such a use-case is very similar to the feature @demacdo explained a few posts above.
The spectrogram is obviously also nice, and I will try it out as soon as it’s available in a nightly build.
All in all I’m very delighted to see this support in VTK/Paraview because it means that we are not the only ones working with acoustics with these tools!