Hello!
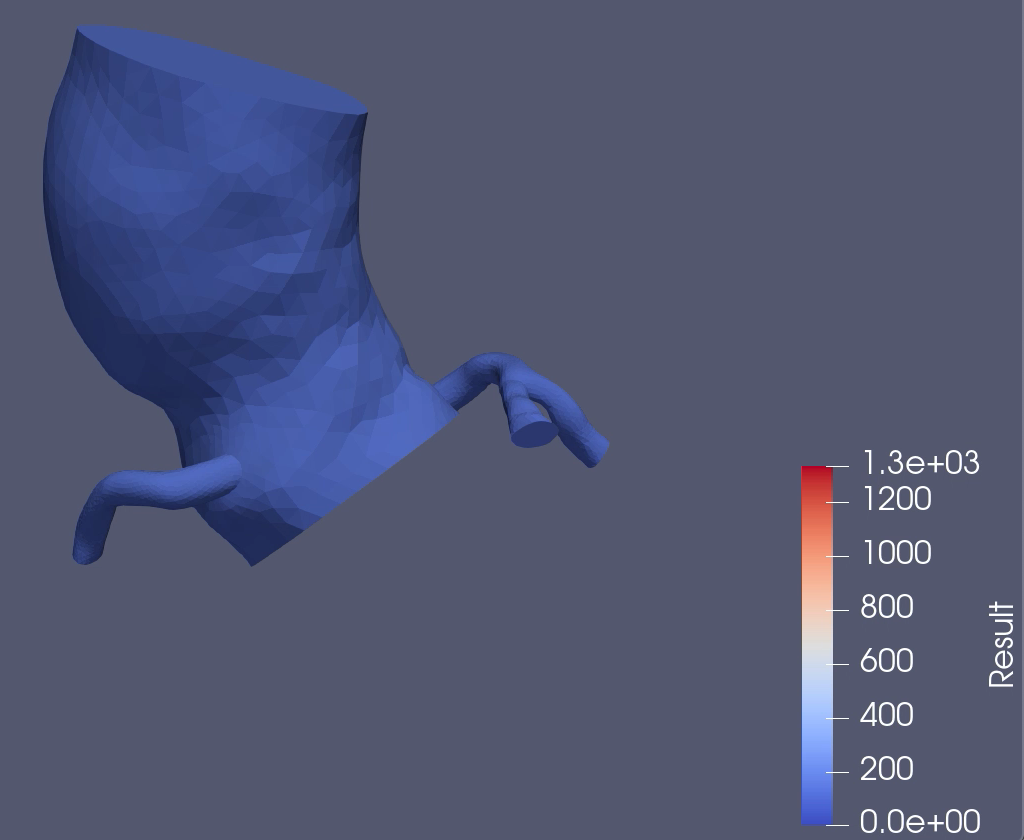
I recently uploaded a simulation to ParaView via SimVascular and was trying to adjust the data table that is shown when average pressure is being portrayed on the model. I noticed that the colors my model portrays are only blue, even though the table on the right hand side goes up to red and white. I would like my model to portray these other colors, but will need to adjust the table to correlate more closely with the model pressure.
On top of that, I have another model for aorta and coronary arteries with an extremely low pressure, despite converting back to mmHg. I included a picture of the low pressure in case anyone may know how to fix this issue. Thank you in advance!
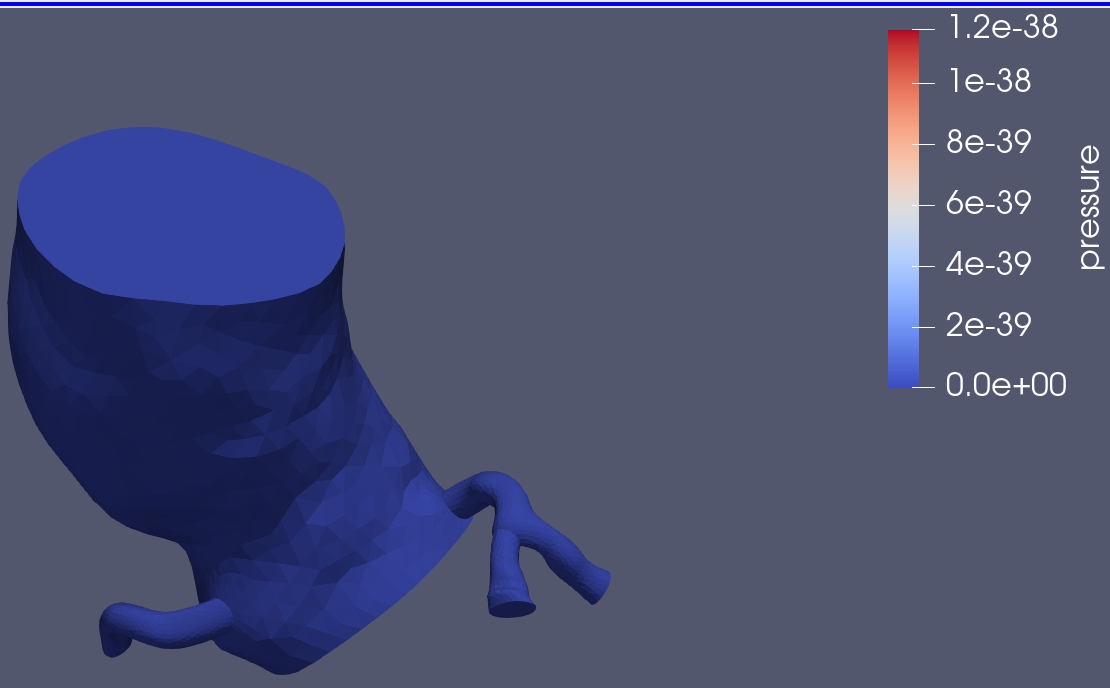
Look at the value in the scale, it is basically zero to zero.
I suppose your data is all zero.
Please share your data.
Sure, click on the custom data range button : ![]()
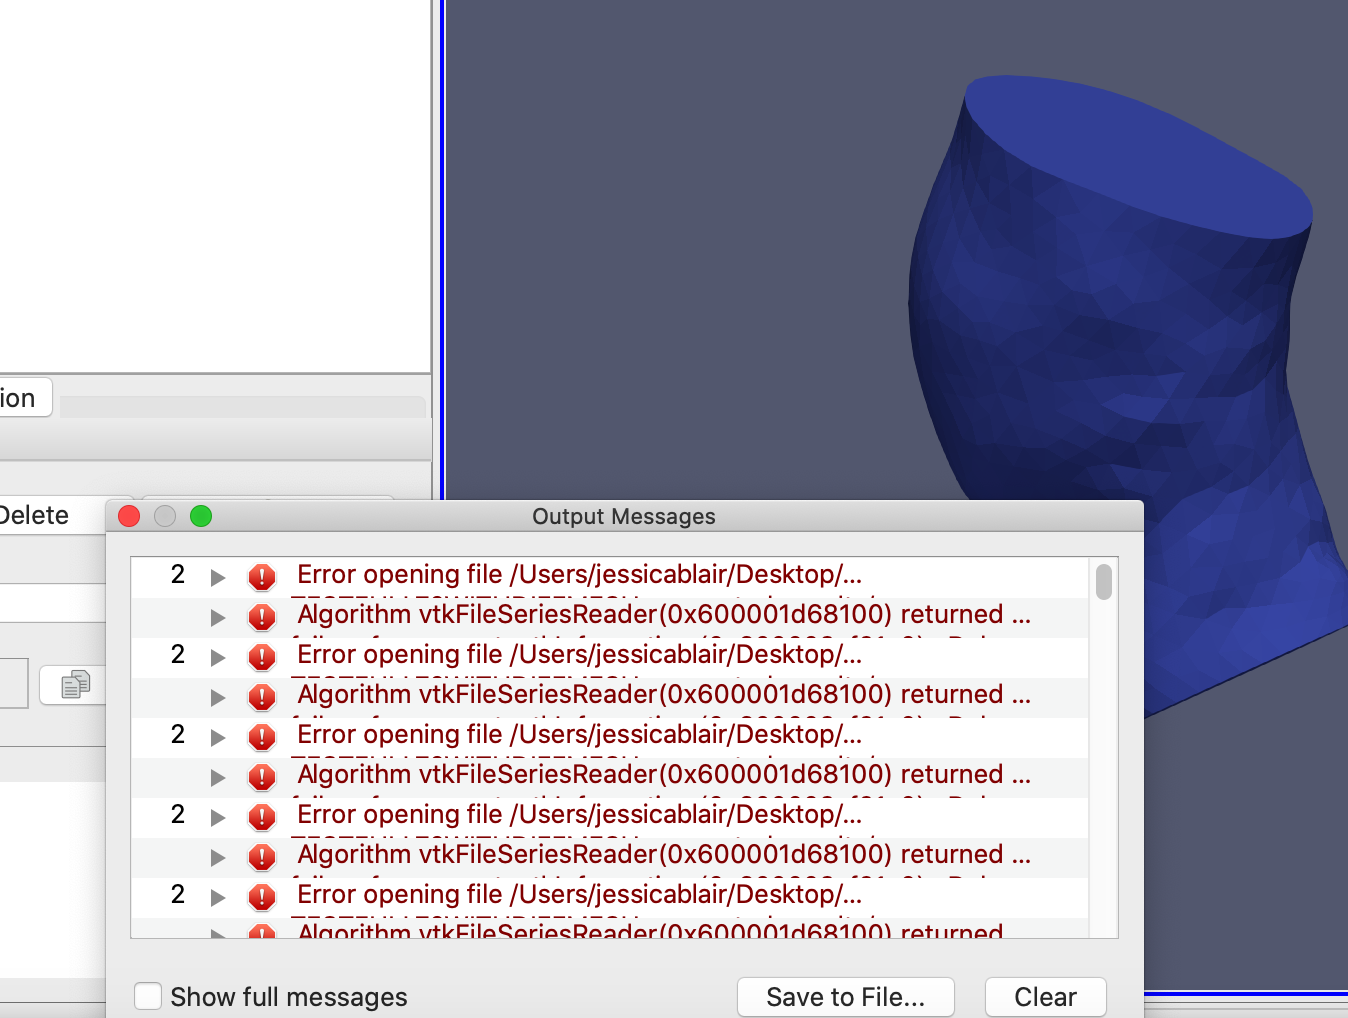
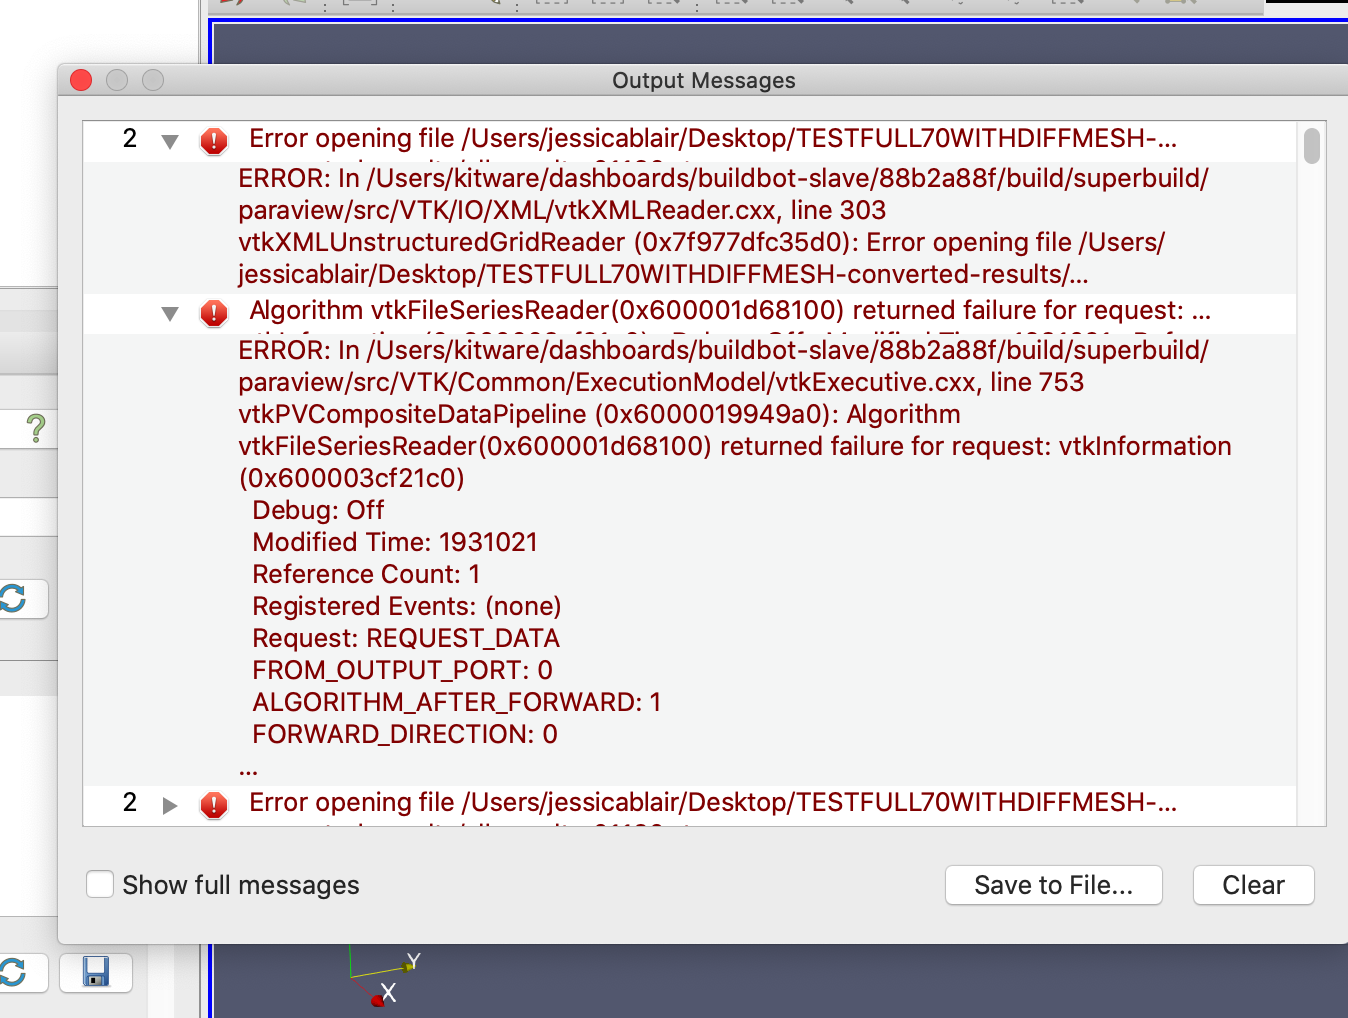
Looks like a completely unrelated issue.
Okay, thank you.