I have some step-by-step field data 3D animation and CSV files with corresponding model parameters, probe readings.
The format is simple: a column for time, and a column for values.
1)I want to make an animated plot with these parameters drawn over time like on data-logger, or EEG tape.
See img.1
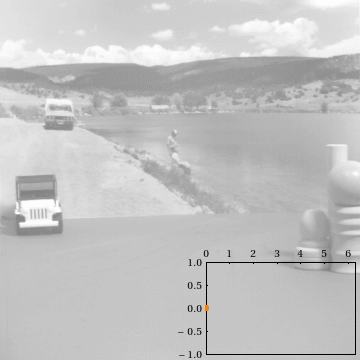
2)If possible, stack or overlay this plot animation over 3D field rendering, when exported to video file.
See img.2
I could not find any manual telling how to plot 1D (2D including time) data; just some tutorials with extractions of pre-structured data from field data-sets, which is different.
P.S. I guess, the key here is defining time steps basing on the first column in one way or another. I did not find any document explaining this important topic.
This is a use case not well supported by ParaView, I am afraid. The ParaView user base isn’t plotting time-dependent 1D data in this way. More commonly, people extract data along a line segment in a 3D data set and plot that. The 3D data may even be time-varying, in which case the 1D data varies (but does not grow from left to right as in your examples).
I"m sure it would be possible to write a CSV reader using a Programmable Filter that informs ParaView of the time in the time column and provides only the data up to that time point for plotting.
As a starter, I tried to make a programmable source for assigning every data step to a, time step… but I don’t have necessary knowledge there was a post at CFD-online, but that method does not work with current version for some reason. I.e. I don’t know how to fix that code for importing full-range time/data-set with float time labels.
And well, making animation by other means, seems only possible by dumping 770 PDFs from Octave, and then combining them to one GIF…
considering theoretical capabilities of plotting, there is plot_data_over_time filter. there is also streamline filter, and Contour by “IntegrationTime”. I guess, those would help building the animation, but only when I prepare the time-dependent data.
Octave is one tool to use, and it there are a lot of tools out there to generate animations, videos from a series of image/PDF files. I am most familiar with ImageMagick and it gets the job done.
There are also other good plotting if you are comfortable with Python. matplotlib is a popular plotting package, and I can imagine it wouldn’t be too hard to generate the animation you are seeking with that tool. But you’ll need to invest some time learning it first. And you will still probably need to generate a set of images for each time step and use another tool to generate the animation.
 there was a post at