I’m using Paraview on Salome-Meca 2019. And I use Code Aster for the simulations. But this is a question about post-processing.
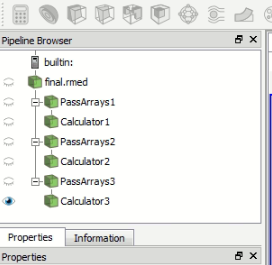
My simulation consists in using a loop to move a heat load. Currently, I save each result in the same file, as shown below.
.
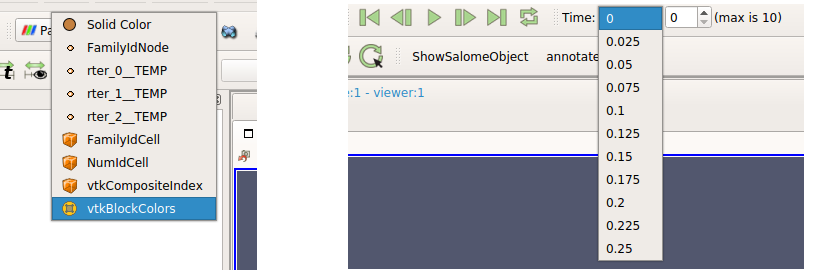
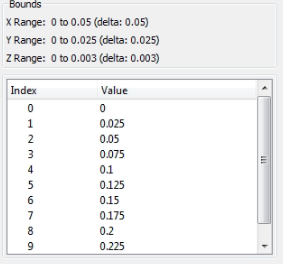
As you can see in the figure, for each RTER my time goes from 0.0 to 0.25. When in fact, rter_1 goes from 0.0 to 0.25, rter_2 goes from 0.25 to 0.50 and so on. This way, I can’t make an animation that shows the entire simulation time. I have to view each RTER separately.
Is there a better way to save the results in Aster, so that each iteration is added with its respective time to the results file? Or is there a way to loop through all of RTER results in Paraview?
I understand that is another viewer. I left a post on the Aster post-processing forum a few weeks ago, but despite several views, no one has yet responded.
As I understand it, the only difference between Paraview and Paravis is just the MEDreader, the rest of the software is mostly identical.
Regarding my left figure, its not possible to loop trough rter_0_TEMP to rter_2_TEMP in a animation?
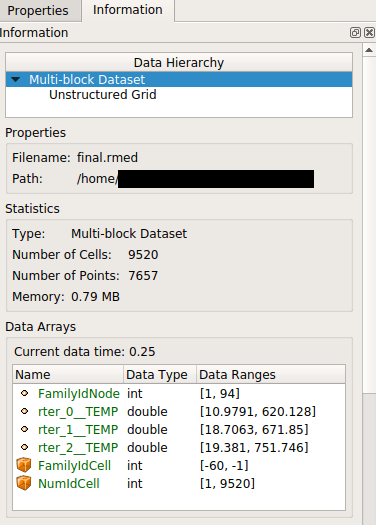
My data blocks appear as below.
Given my dataset Information and Properties, can you point a direction that may help, as the question seems to be independent of the viewer? Maybe using a ProgrammableFilter I can create some kind of loop for the animation? Or join my data in only one block?
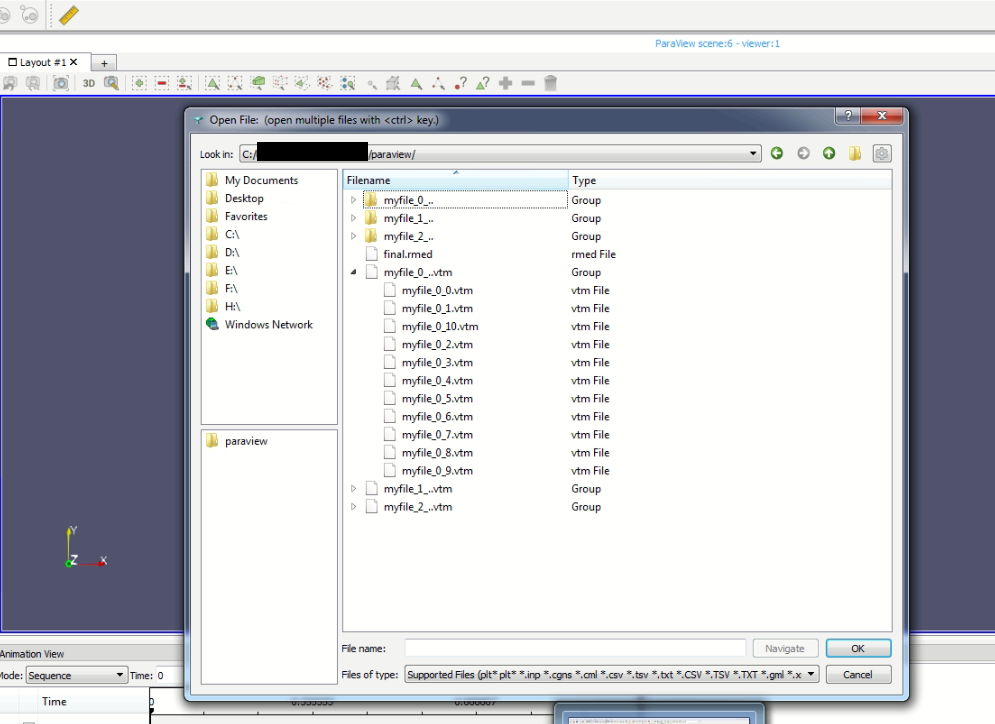
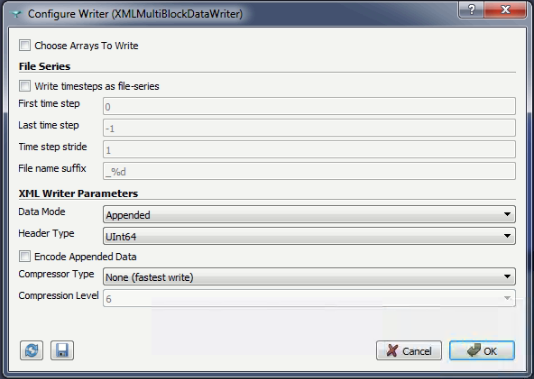
I think I understand what you’re trying to do with the results. Unfortunately, I think Paraview did not save as we would like. When I try to open as you instructed, the following appears:
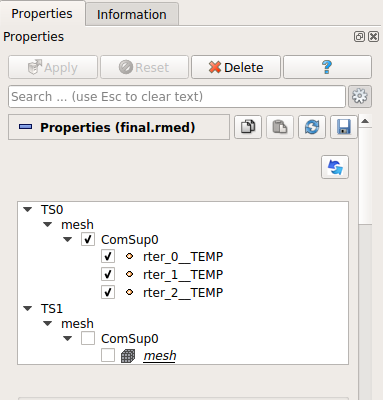
I was able to follow your steps, making a modification in the “file name suffix” field when saving the data. However, the problem seems to be with the saved time indexes. Each ‘rter’ is saved with same indexes as shown in the figure below:
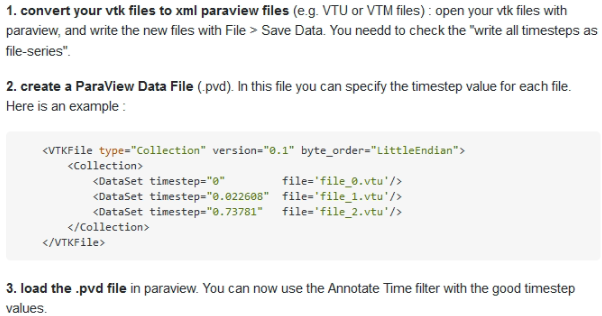
Checking a way to change the time indexes of the results, I found the following post, talking about Paraview .PVD files. Would it be possible to do something using this approach? Perhaps it is possible to apply the desired “Dataset timestep” to each file generated by your step by step?