Hello,
It’s my first time using paraview. I’m trying to do a visualization of data from MPAS model- data is read from netcdf file (with unstructured grid with lat/lon and some ocean data) using Netcdf MPAS reader. Is there any way to apply non-transparent ‘land’ mask to land areas?
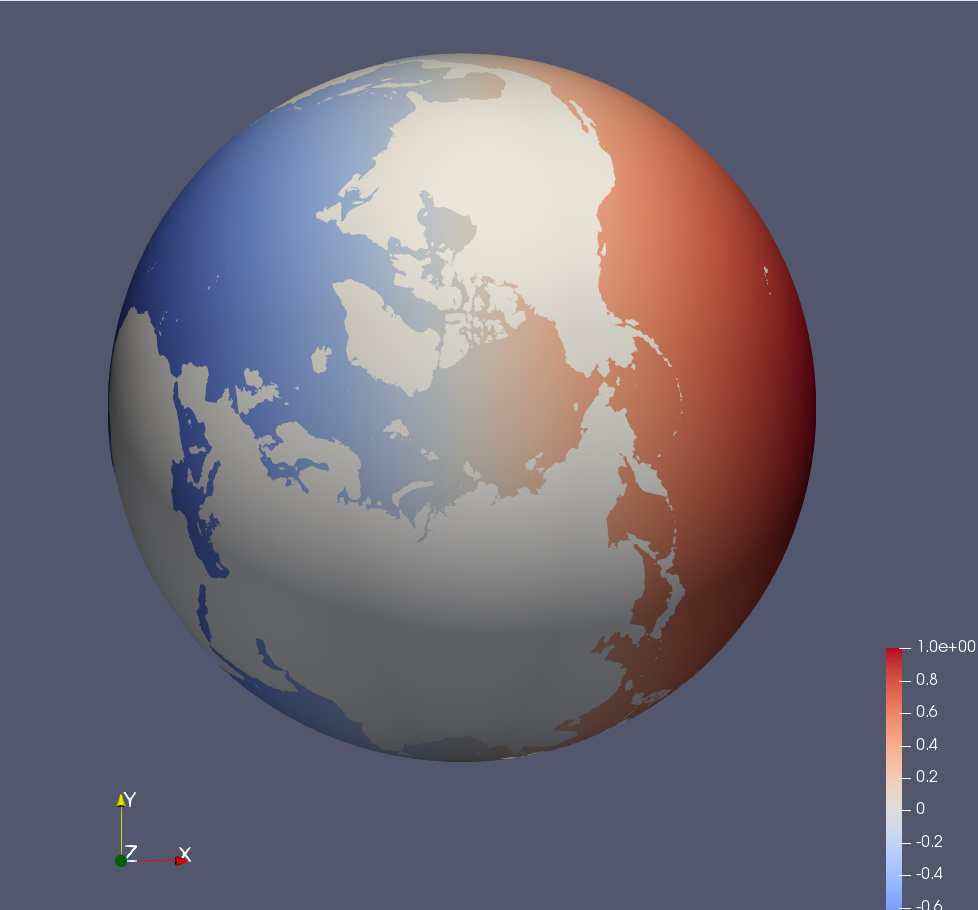
As shown on the screen - I’m plotting some values on the ocean, but there is no values for land - so it stays transparent, what makes it less readable.
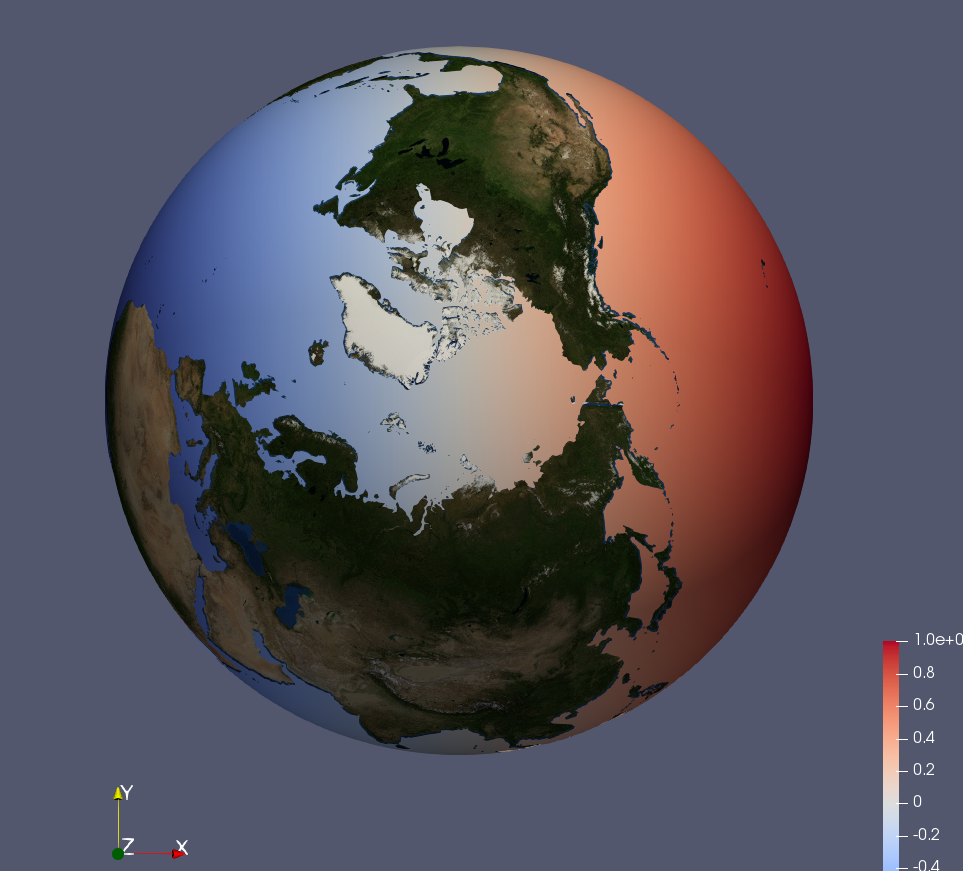
Since your model seems to be only on the surface, you can create a sphere that has almost the same radius. That will give you a core that you can color the way you want.
@nicj looks like suggestions from @jourdain and @igor would work for you. Just curious are you at the DOE lab? Let us know if you need more help. @danlipsa
@nicj can you send us the data? we can look into if there is another easy way. We had GeoSource in VTK that would create the earth sphere but it is no longer maintained so we probably have to think other way of adding support for it.