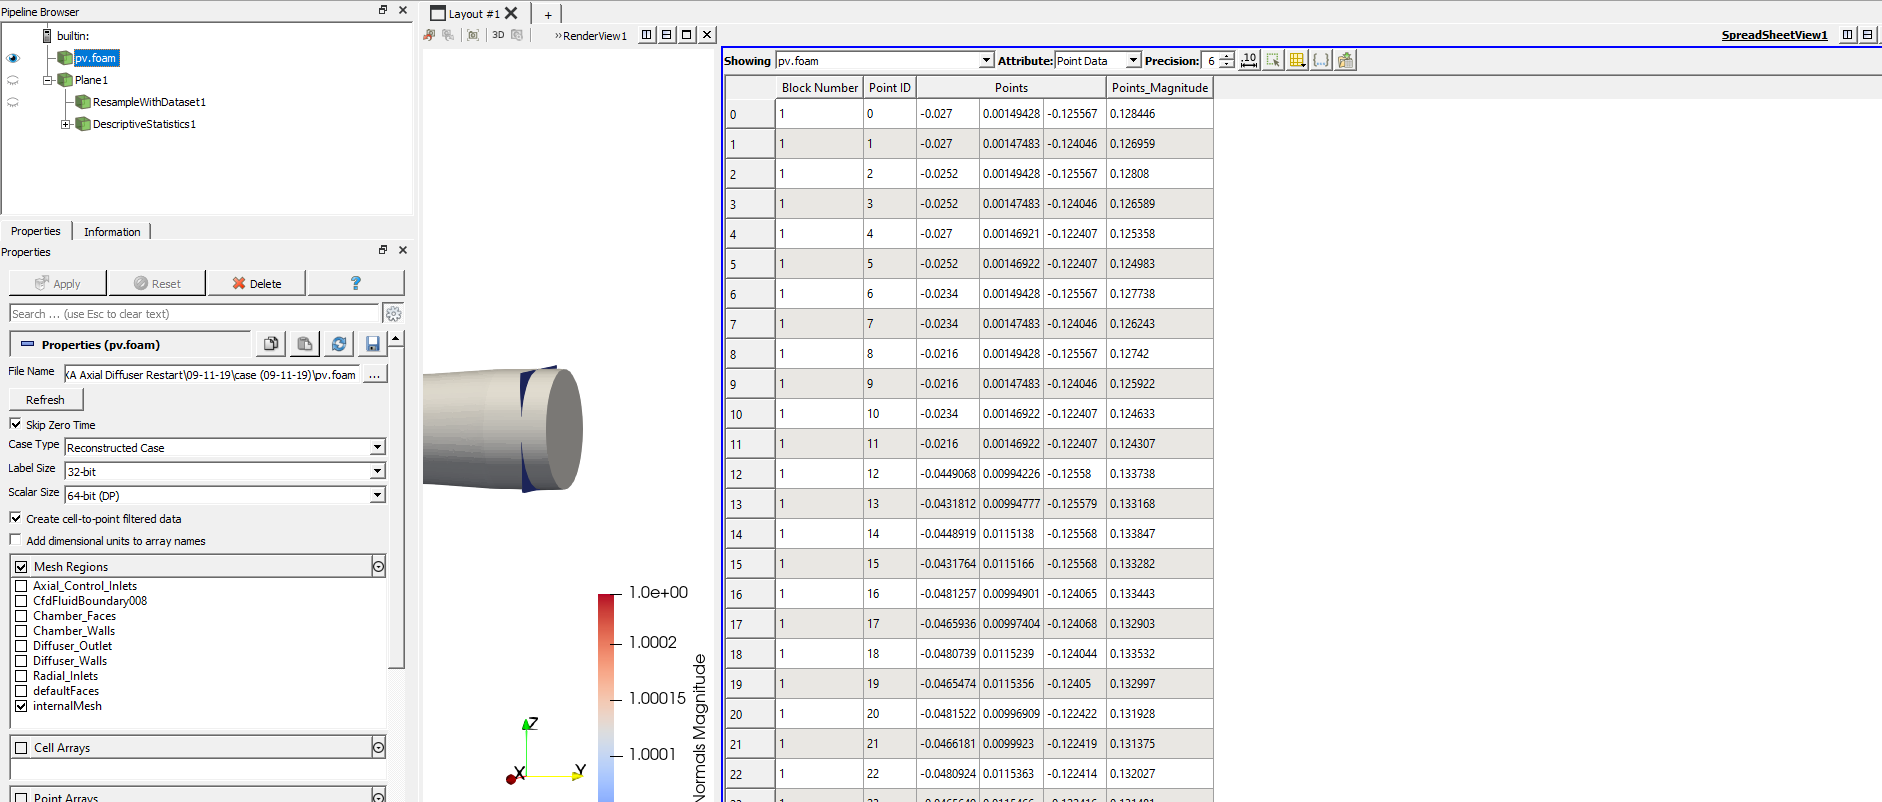
But it’s not clear that the velocities in pv.foam are velocities from the resampled plane? They are not available in Plane1
They are not
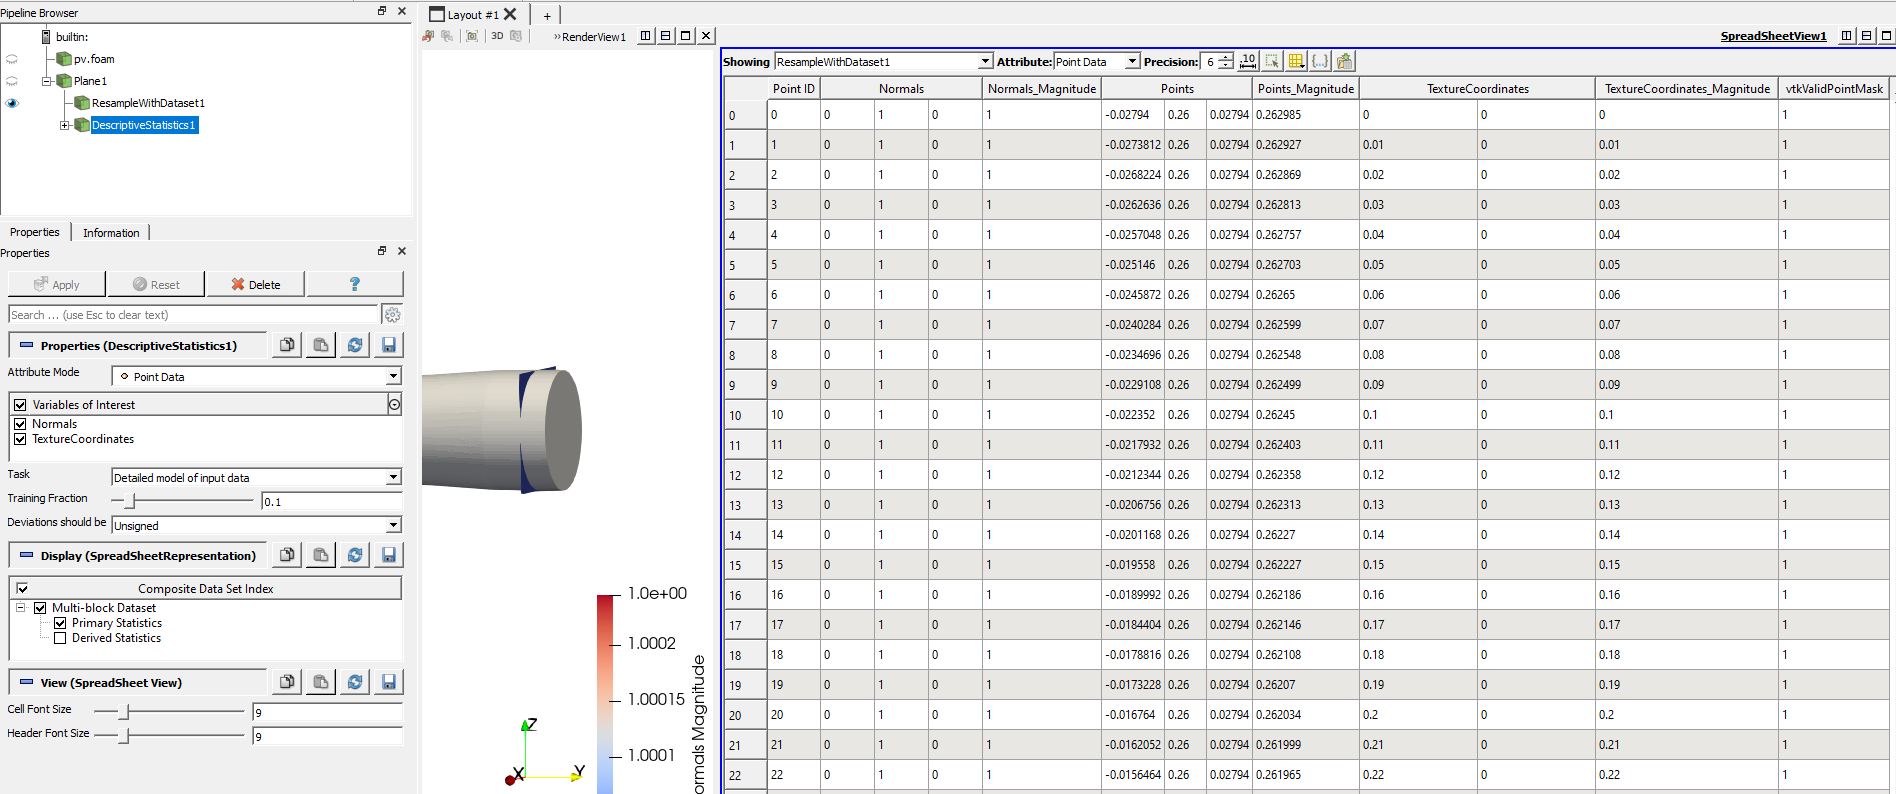
In the “Showing” combobox, select RessampleWithDataSet instead.
But it’s not clear that the velocities in pv.foam are velocities from the resampled plane? They are not available in Plane1
They are not
In the “Showing” combobox, select RessampleWithDataSet instead.
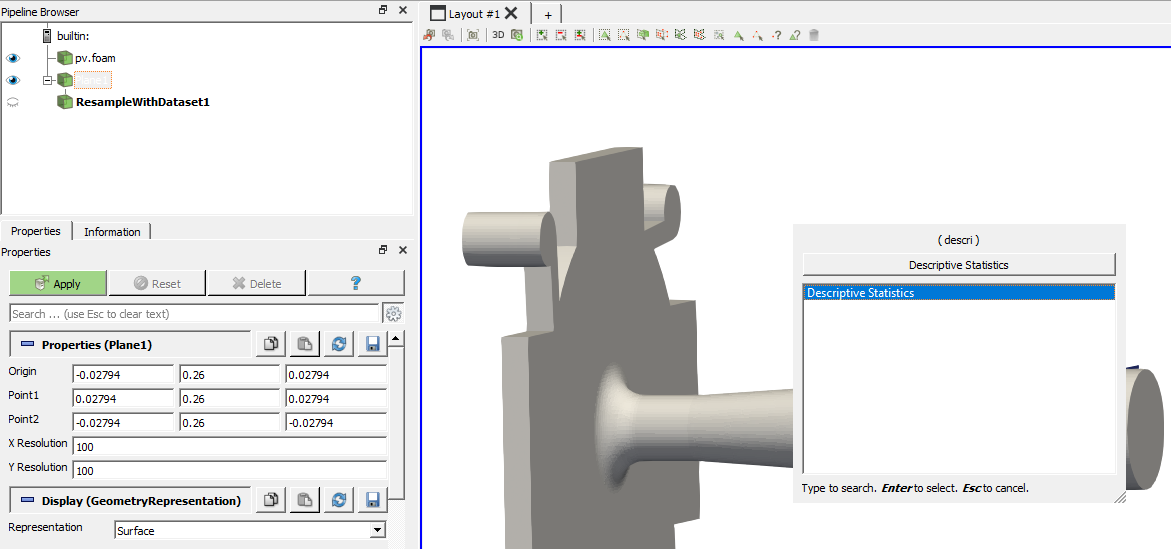
I’m sorry, I’m clearly not undertstanding your suggestion here. I have started from scratch several times and have not found this “showing” combobox. Here is the sequence of my steps that I actually followed to aid my own understanding:
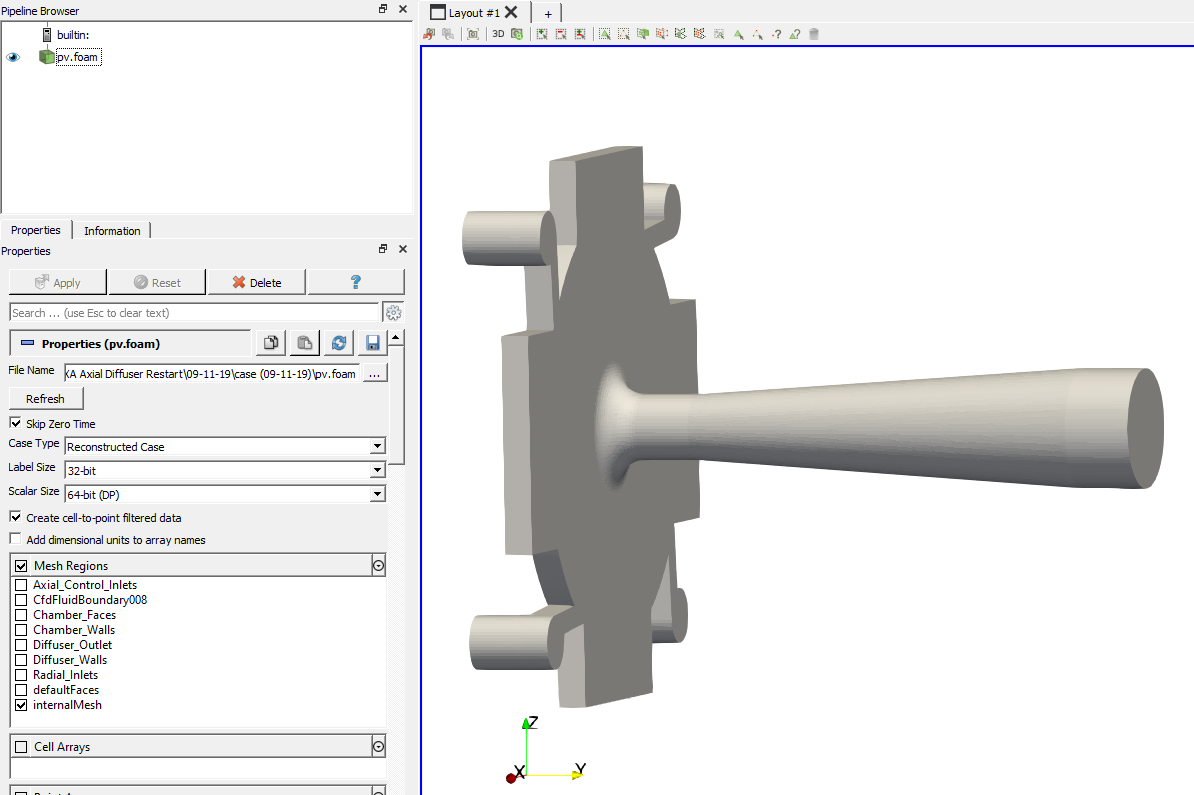
Starting from my CFD source
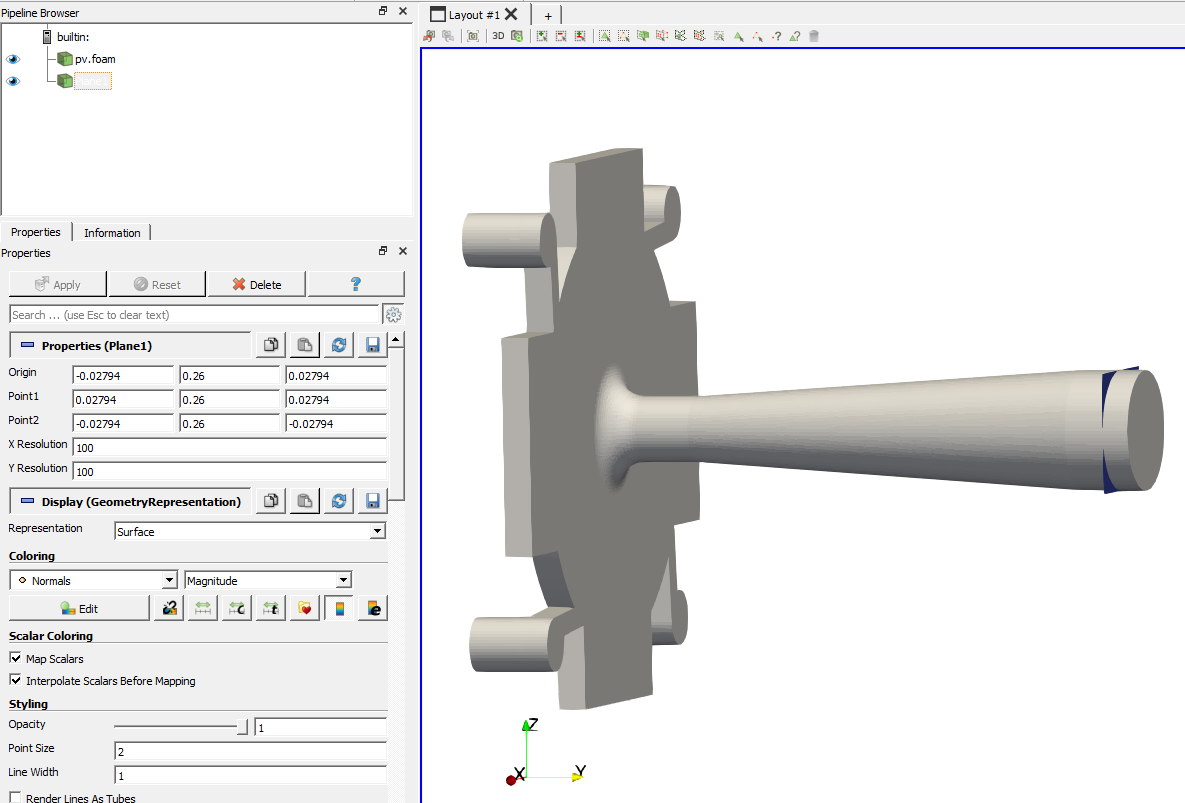
Adding the 100x100 plane
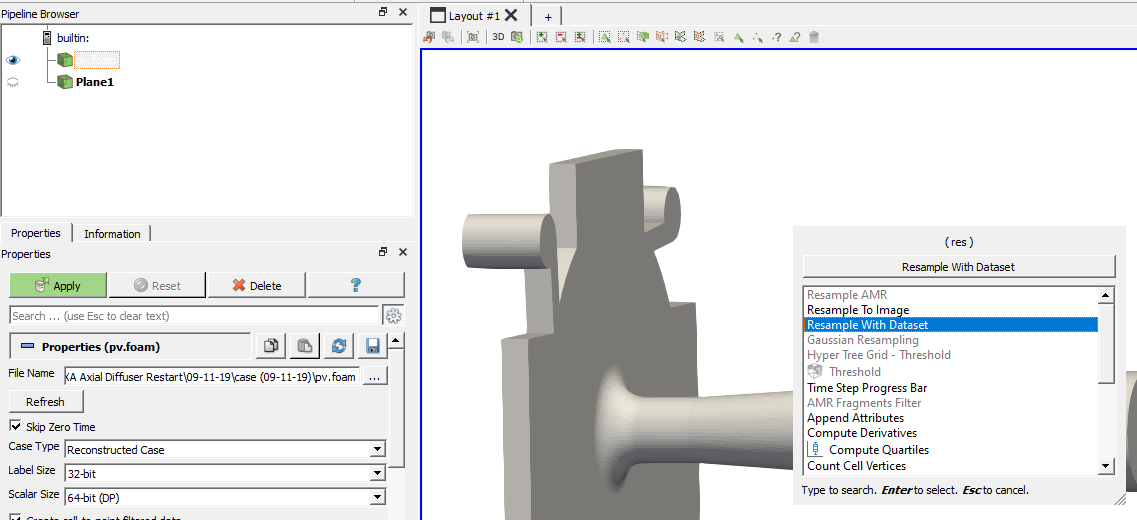
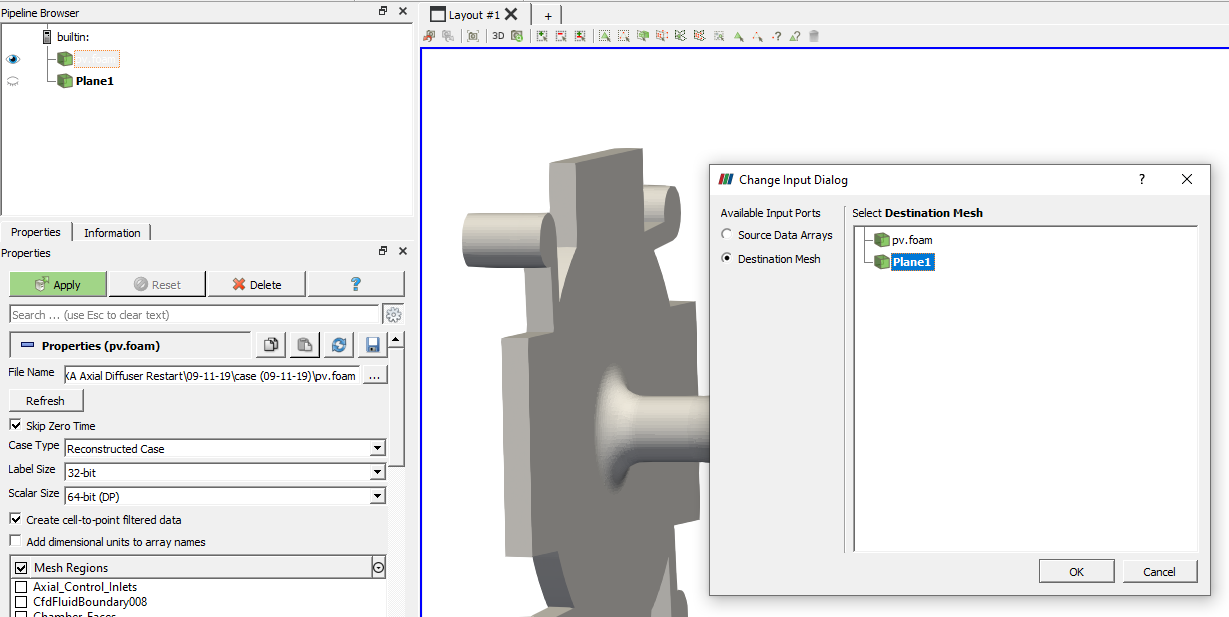
Resample with dataset.
Is this the “RessampleWithDataSet” combobox that you refer to?
Add descriptive statistics
Providing the Descriptive Statistics dataset with no velocity data
I will now look into this again because I didn’t get my x,y,z velocity datasets in the plane or even pv.foam dataset
Sorry again had to do this for myself but hope ot will help with my understanding. I’m learning a massive amount with your support. Thank you again!
Michael
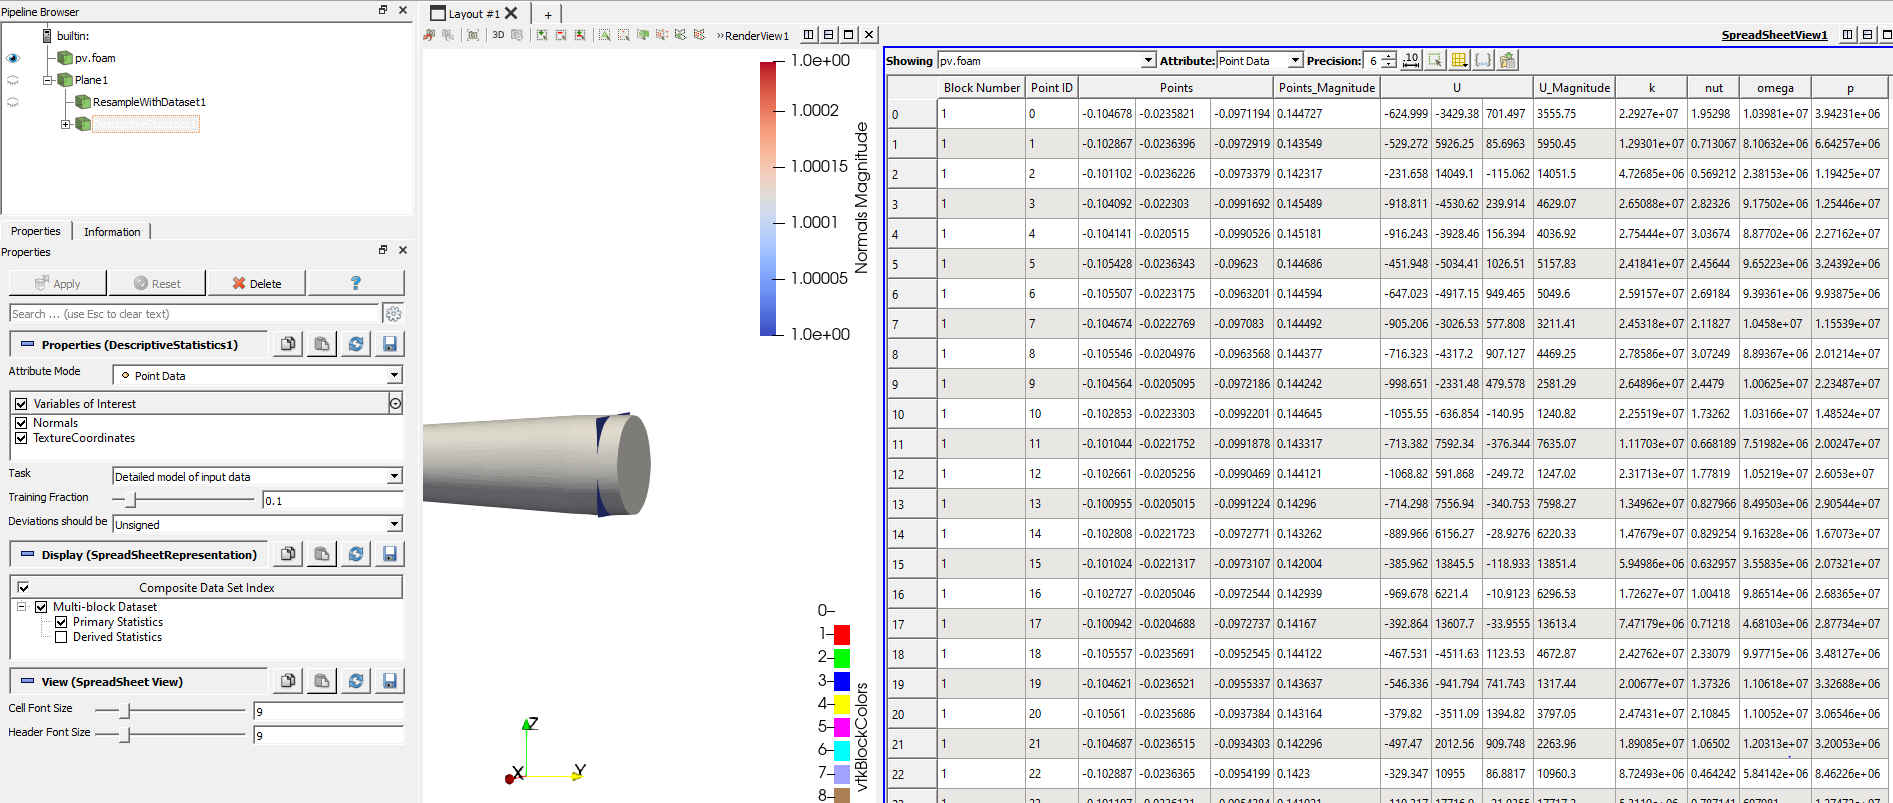
While trying to develop a greater understanding I plotted the data points from the pv.foam dataset, for my own interest. Great to have my understanding confirmed and the result is I now know how to obtain the data I want, but learning how to clarify my understanding of your guidance would clearly be a great help.
Thanks again
Michael
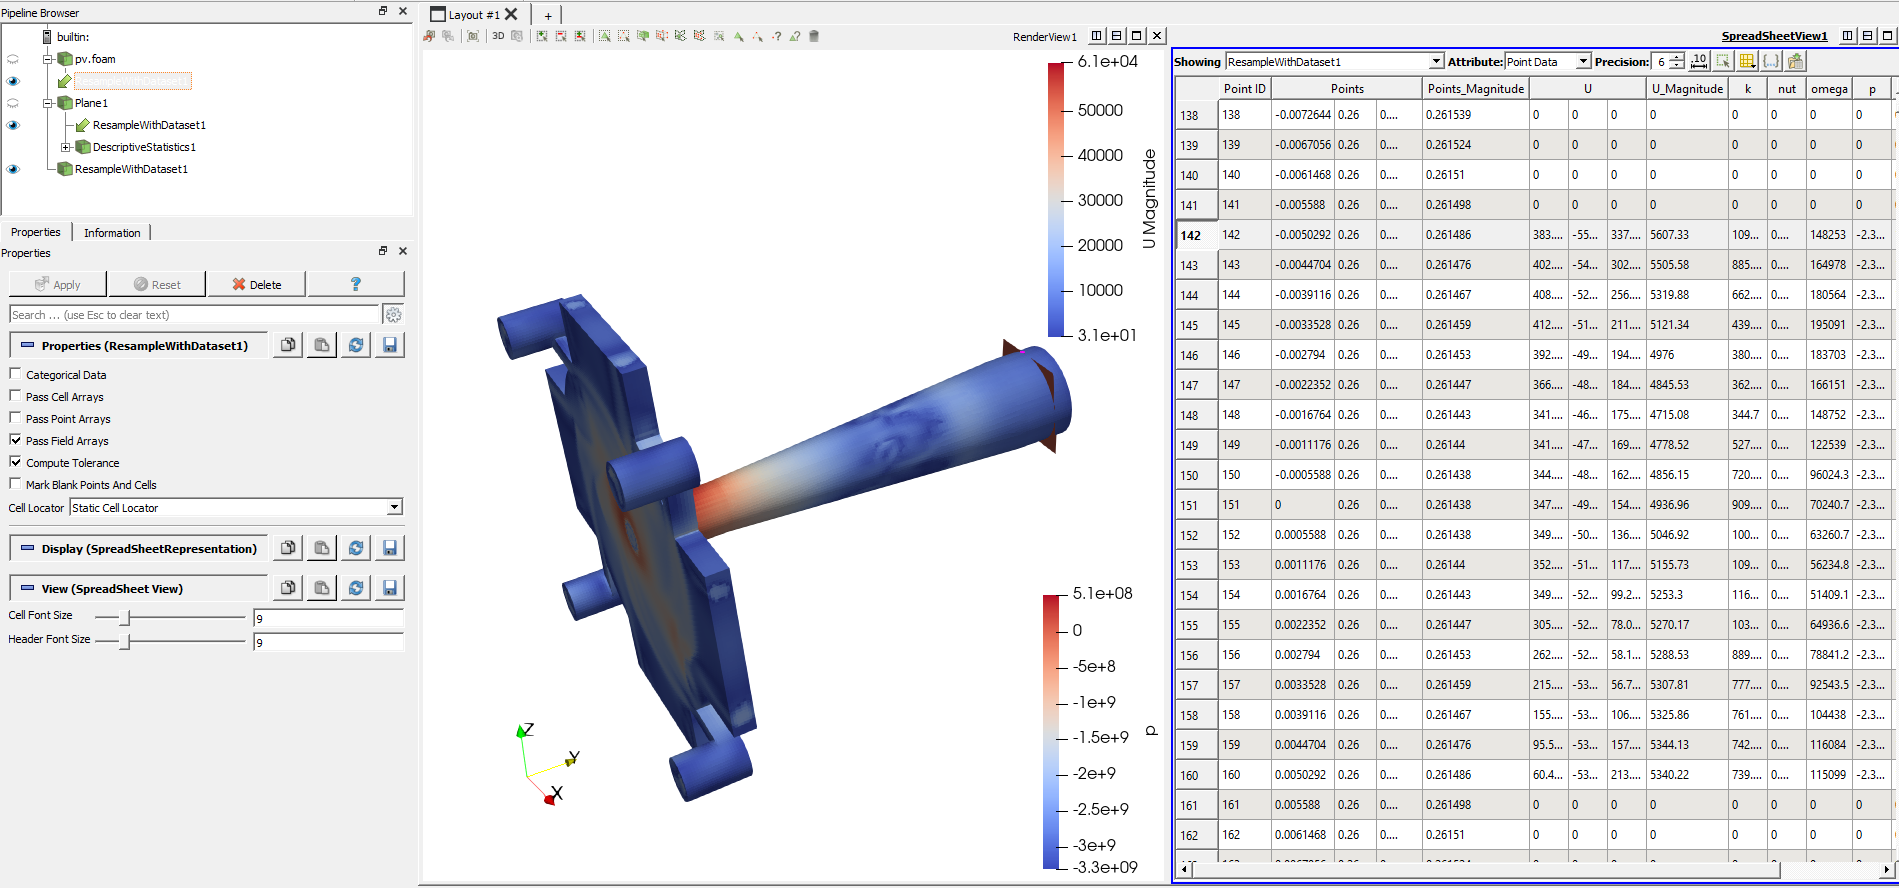
Here is how to use RessampleWithDataSet :
Thanks again, you’ve been a great help. Covid lockdown had stalled everything of late but now back in the flow. New notebook, FreeCAD and ParaView versions now up and running with a few complications. Quick question that I’ve pondered in the past. ParaView only reports velocities in m/s doesn’t it? My FreeCAD units are mm and recent new model is reporting very high velocities and flows in ParaView. Thanks again and sorry to trouble.
I may be corrected here, but I believe ParaView is unitless. In other words, if you use measures of handspans per newmoon out of your simulation, you will get output from ParaView in handspans per newmoon.
You can get artificial units in ParaView by using these units as part of the variable name. Alternatively, if you wish to change units, you can always use the calculator filter.
Thanks Walter, I’m looking into this and do my analysis in Excel workbooks. Cheers!
Massive success, in my terms, since my last contact and thank you!!
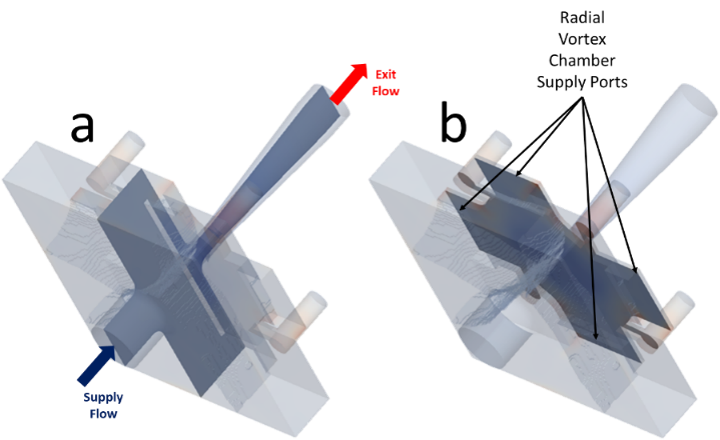
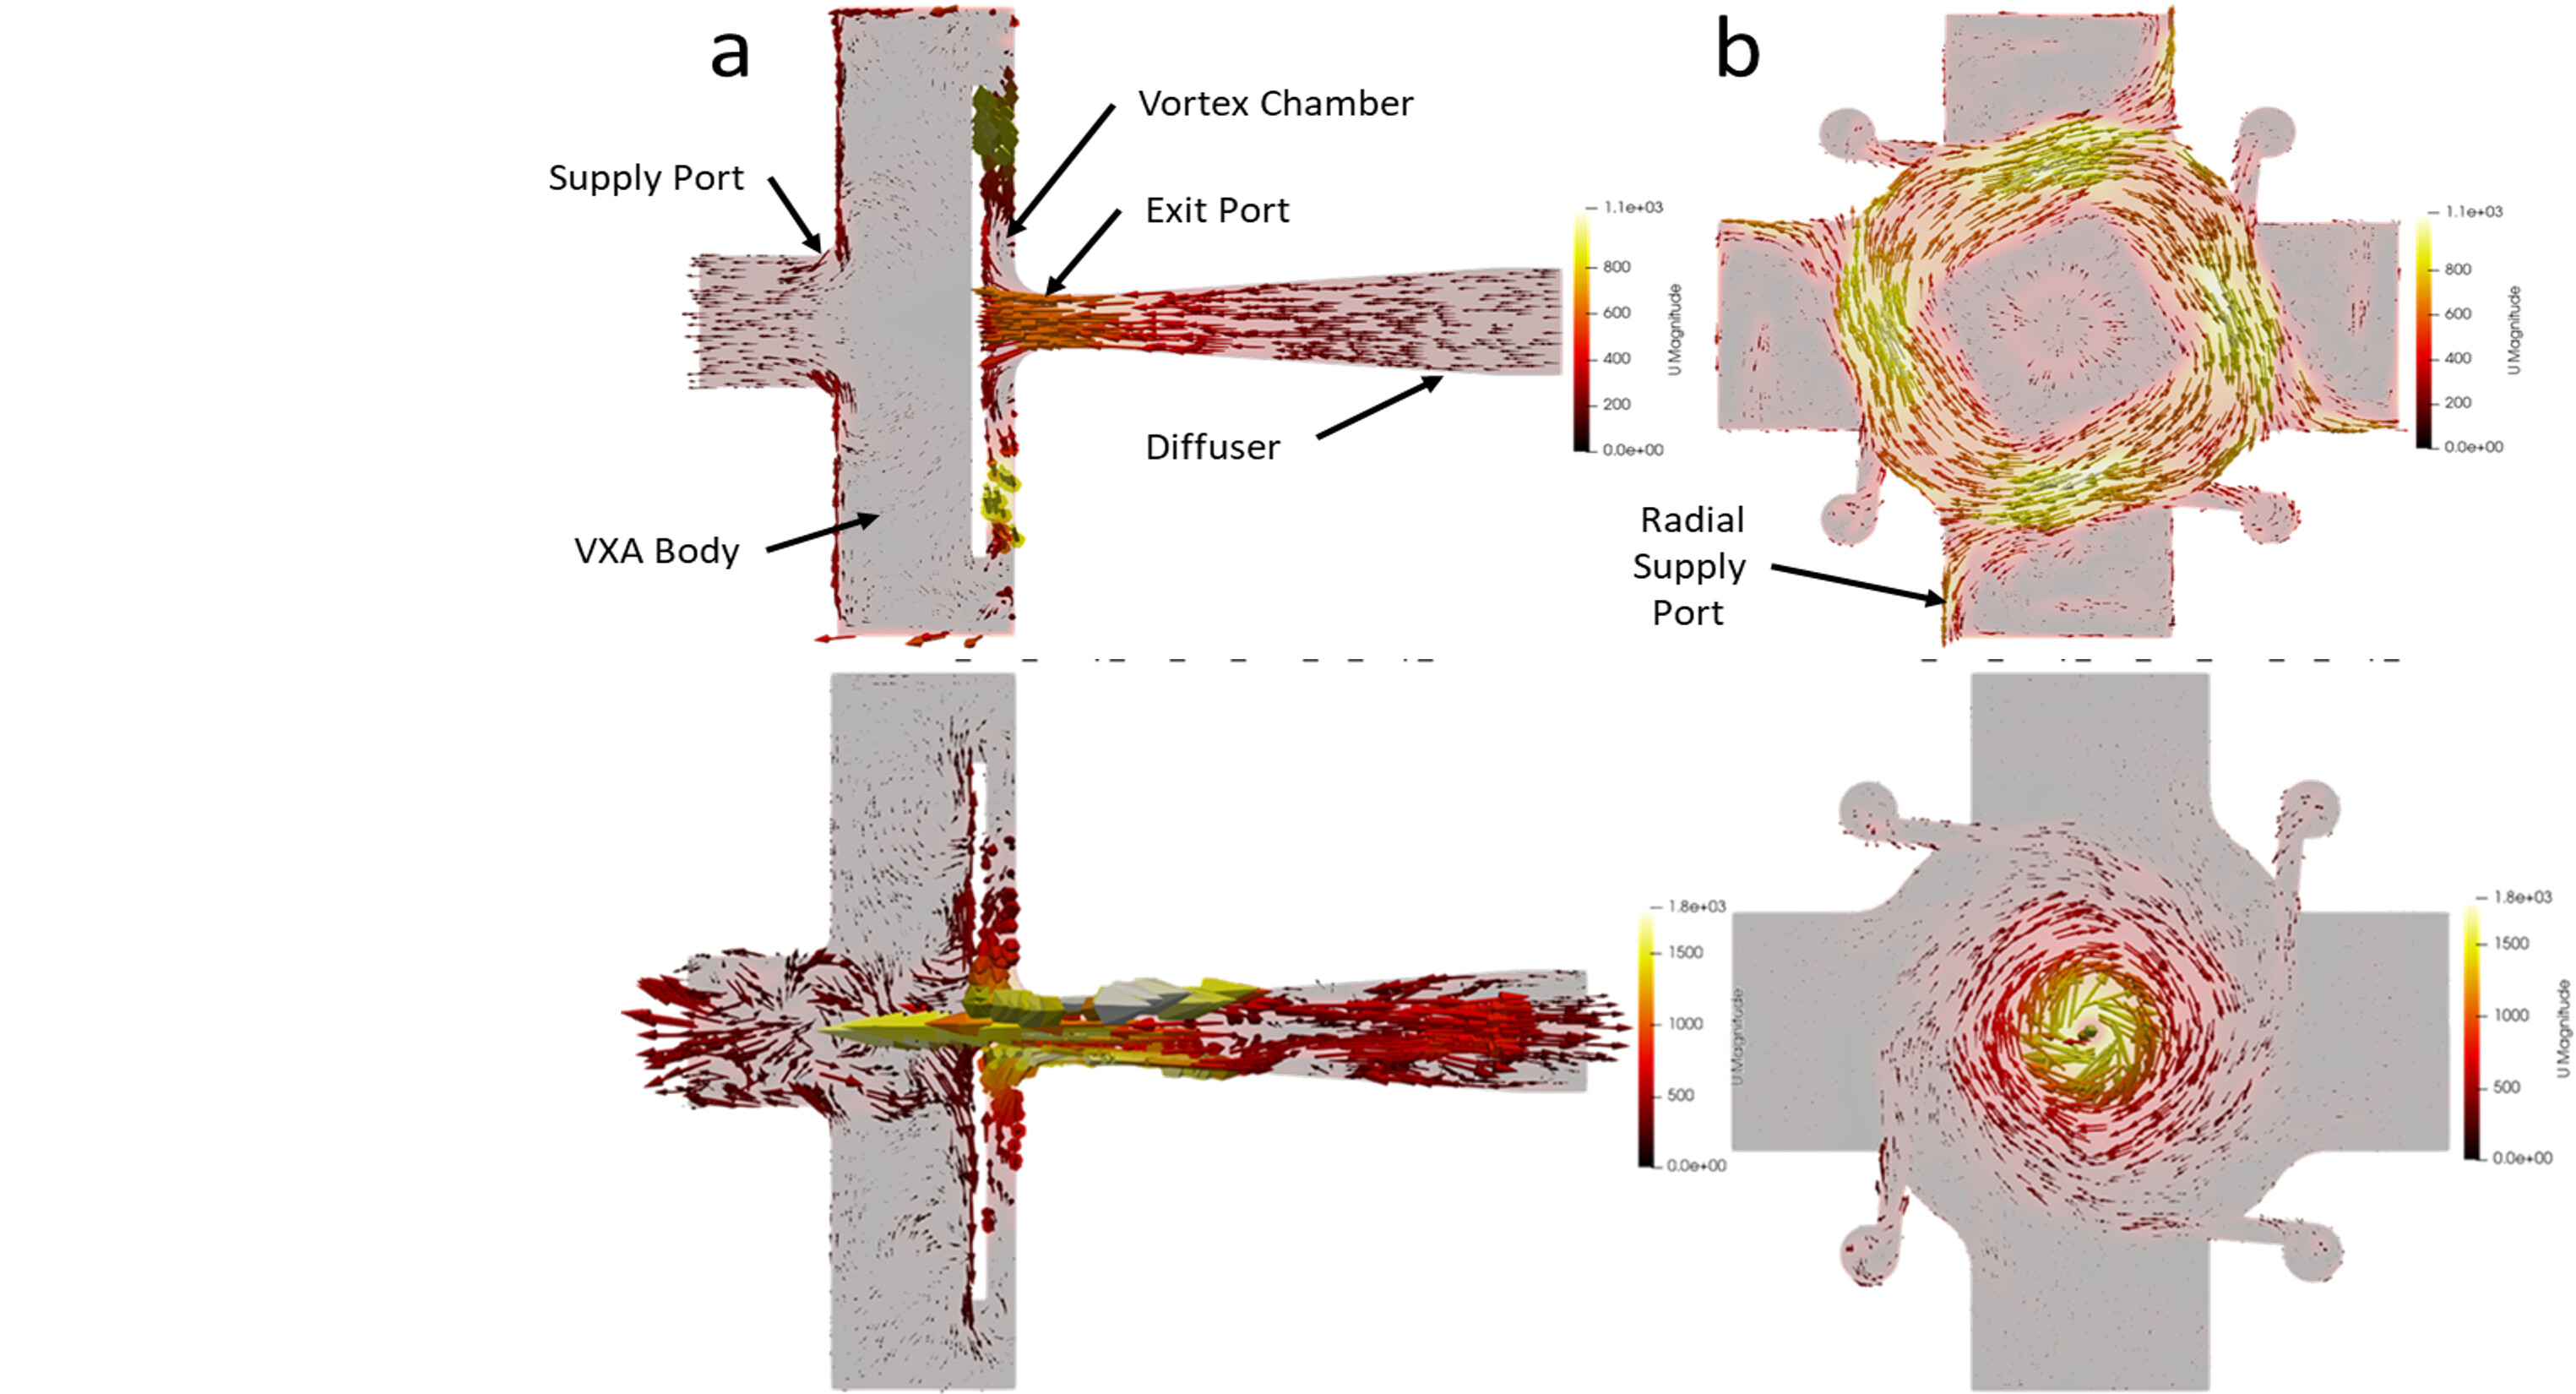
I now have a model that has given me great calculated average velocity results from planes in the Supply (Inlet) Port, to the left of the device. But I’m having great dissagreement with axial slices. Therse are the slices I am using
And these are the ones in question
I get zero or positive, left to right, velocities from my plane calculations in the left hand Supply (inlet) port but these scaled velovity images are all negative, right to left. I think this is something related to velocity scaling so could you please direct me to some help in using the scaling option.
Here is also a brief PDF note that I’ve posted to LinkedIn that I hope may explain my velocity sclaing concerns.
Crossley - Preliminary CFD Modeling of a Historic Vortex Amplifier - Rev P2 DRAFT.pdf (1.5 MB)
Many thanks again
Michael
Hello again,
After great success and experiencing more problems after major changes to my model, I have a further question. And sorry for the long explanation and question.
I have learned a great deal from your support and after further CFD modelling experience I now realise that I have been ignoring concerns to obtain an acceptable result from my learning models. I’ve had to ignore strange results that did not fit my expectations, one of which was negative velocities and hence flows.
I now realise, think, that my choice of only using positive velocities has hidden a clear indication of negative velocities from my model. My model geometry complete and with hindsight suggest that the negative velocities should be expected.
The result is that I now feel that I need to try to include all the data and want to consider the use of the resolution of 3D resulting velocity vectors in each direction, x y, and z axies. Does ParaView have a tool to allow me to resolve the three velocity components.
Many thanks in anticipation
Michael Crossley
Yes, ParaView supports 3D vector fields quite well, and allows you to access x, y, and z components separately in different contexts.
Thank you Cory,
That is what I was expecting and thanks for confirmation. My 3D word is very limited. Result is I must make a concerted effort to learn more about ParaView. A brief pointer would be very helpfull, are we talking about data analysis filters?
The self-directed ParaView Tutorial is a great place to learn more and get some working experience with ParaView, including some examples of using 3D vector fields in data filters and for display: Self-directed Tutorial — ParaView Documentation 5.11.0 documentation
Thank you again Cory,
Exactly where I was hunting but I’m not a good reader, so that will again be a great help.
Regards
Michael and Lynda