Not a problem after great help getting started in ParavVew. But I now need to learn a lot more in order to handle my CFD project.
I am looking to obtain average x, y and z velocities on planes within a simple pipe section. My aim is to obtain the variation in velocity and hence flowrate allong a pipe section. I can plot velocity allong a line within the pipe section but I need an average within the volume. Could you please direct me to some assistance?
It’s a complex CFD model with two inlets and one outlet. Attached is a sketch that shows the single inlet “From Glovebox”, four “Control Ports” inlets and the single outlet to the “Blower” (Fan).
My CFD model is providing the velocities in all these areas but I am looking to calculate the flowrates into and out of the small and larger pipe sections. ParaView can provide me with Glyphs illustrating the velocities in each region and the velocity profile along lines within each pipe.
I am looking for the average velocity and hence flowrate in each of the pipe sections.
Basically, I am looking for the average velocity and hence flowrate in the “Inlet Port”, each of the “Control Ports” and “Exit Port”. I am defining the pressure at each inlet and outlet and need to obtain the flowrates at each in order to generate the characteristics of the device. I would like to define sections in each port and obtain the average axial velocity in each section.
I hope this makes sense and is this enough information? I do not know how to get my CFD data results to you.
Many thanks. I love using ParaView and seriously hope that it can allow me to do this.
Basically, I do not know how to provide you with the “dataset”. My FreeCAD CFD suite is not providing me with a single definable data file. It is providing me with a “Case” folder that holds all the information. Should I request help from the FreeCAD CFD forum?
Thanks yet again Mathieu. Forgive me, I’m still learning all the time and gathering an understanding.
My intention has been to create a series of ParaView Clips in each of the port regions. My model “Y” plane is from left to right of my sketch above so I’m interested in obtaining the average Y velocity at any point. Is this what you are referring to in your last response?
The port velocity vector that I’m interested in is axial (Y axis) in each of the ports. So the plane I’m interested is indeed perpendicular to the velocity vector. It would be a slice through the pipe over which I need the average velocity in the Y direction.
Thanks Mathieu, I do understand how difficult this is due to my inexperience. I’ll try what you are suggesting and hopefully learn how to ask the question correctly. Many thanks for great support.
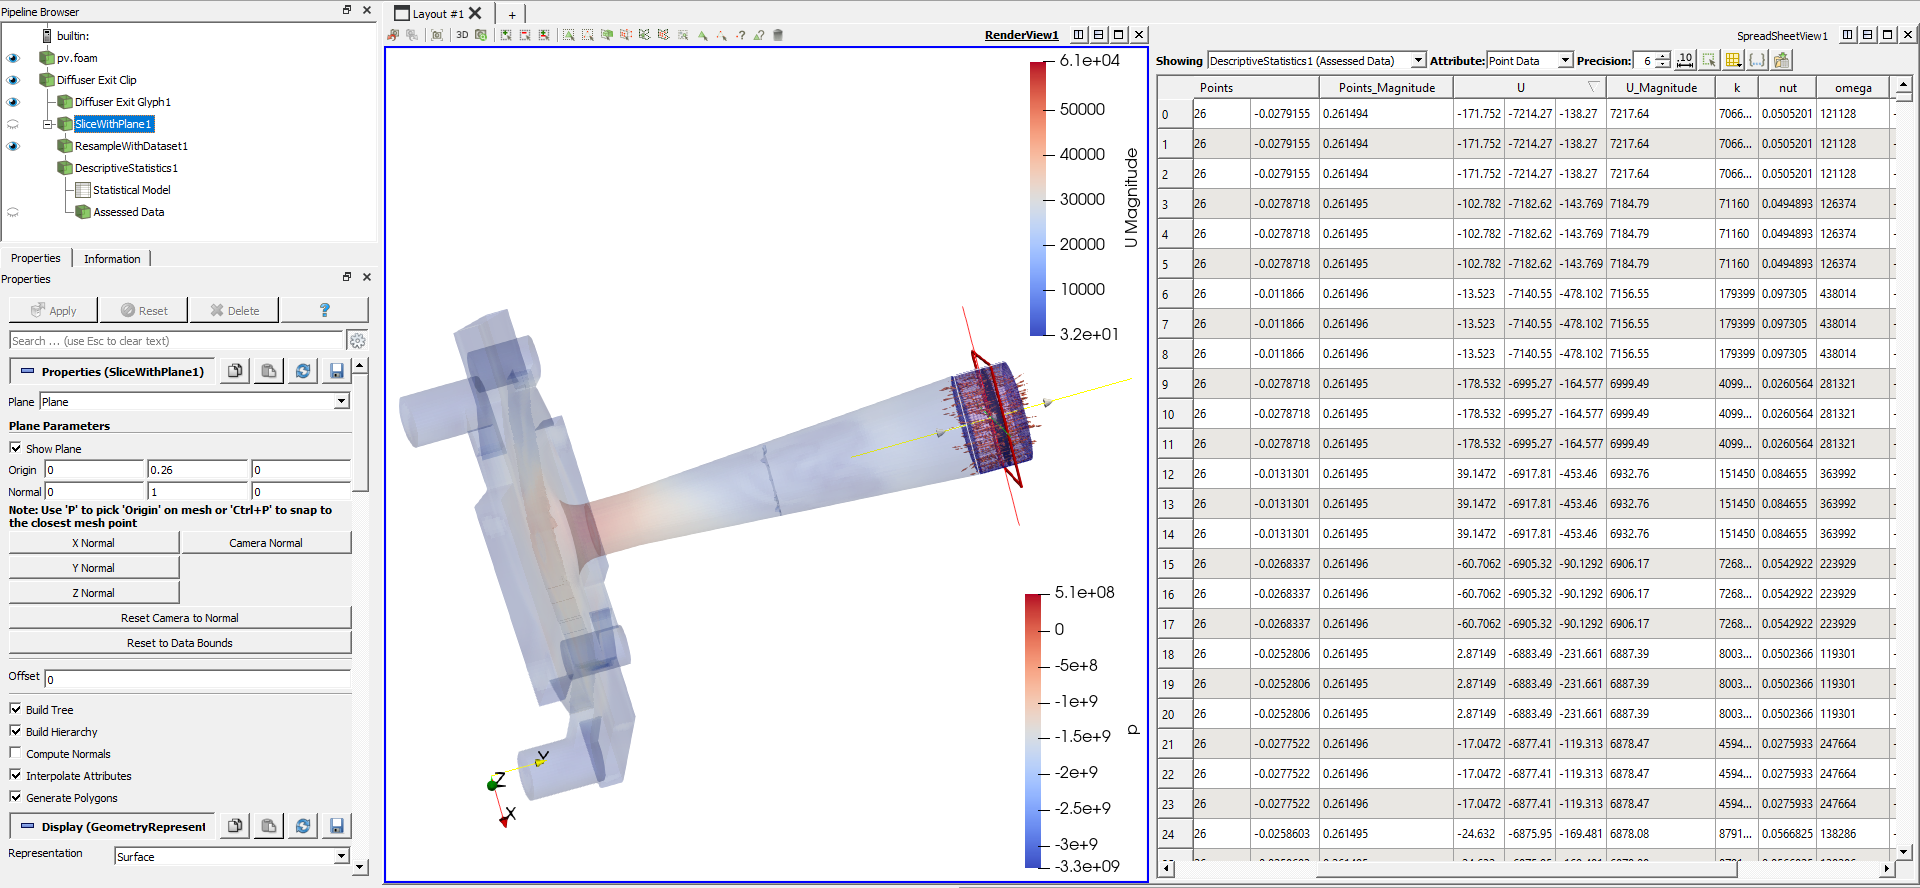
I could not produce a “plane” because I could not find how to rotate it to the one shown above but the statistics look very interesting.
I take it that the points in the “U” column are the x,y and z velocities across the chosen plane which is exactly what I need. Sorry again, I have no clear interpretation, is this across the diameter of the plane or at all mapped points within the plane? The “plain” function gave me an option of two resolution parameters for the plane but not for this slice plane.
Am I interpreting this correctly and should I be able to produce this same “sliced plane” in the “plane” function?
Thank you. I now have some fantastic resuls that have given me a great understanding and direction forward. Well worth my efforts thanks to your help. Thank You Again!!
I now feel I have all the tools to move forward but plesae provide a little more to allow me to search for the next way forward.
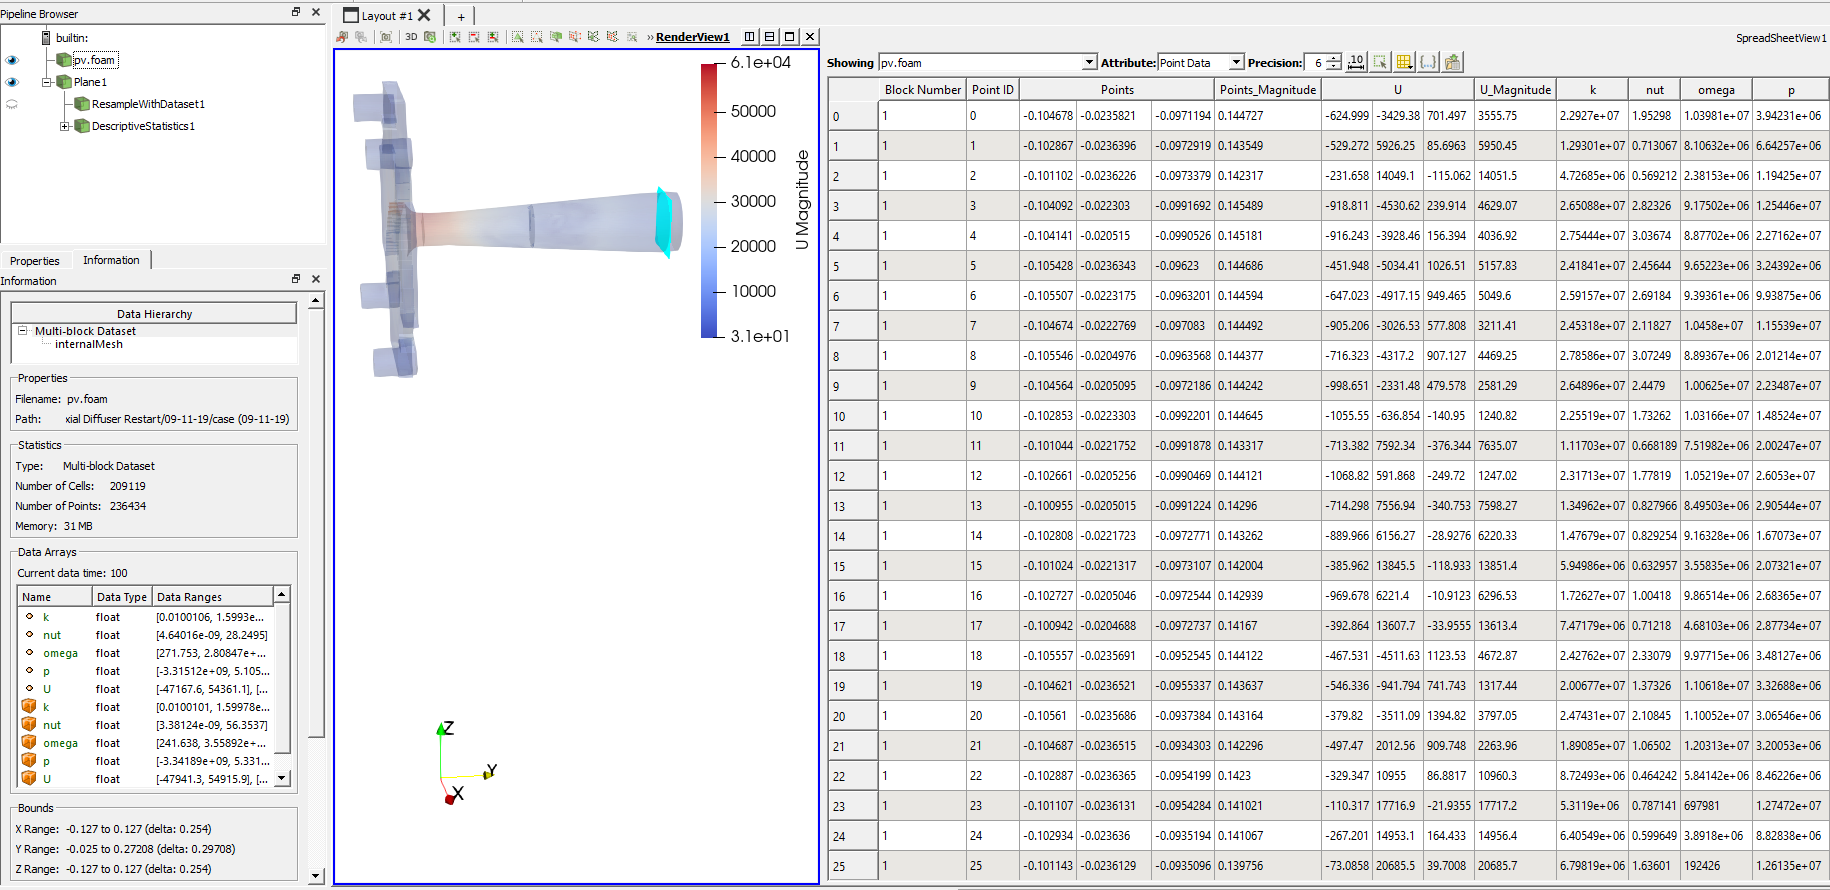
Your procedure has allowed me to produce the “SpreadSheetView” that will provide the X,Y and Z axis and magnitude velocities I require in the 100x100 resolution plane. But I only get the velocities if I select pv.foam and not Plane1.
But it’s not clear that the velocities in pv.foam are velocities from the resampled plane? They are not available in Plane1. Sorry but please confirm they are from the resampled plane so I can continue to search for help.
Thanks again, massive help and sorry for my low confidence. Learning big time!