Hi,
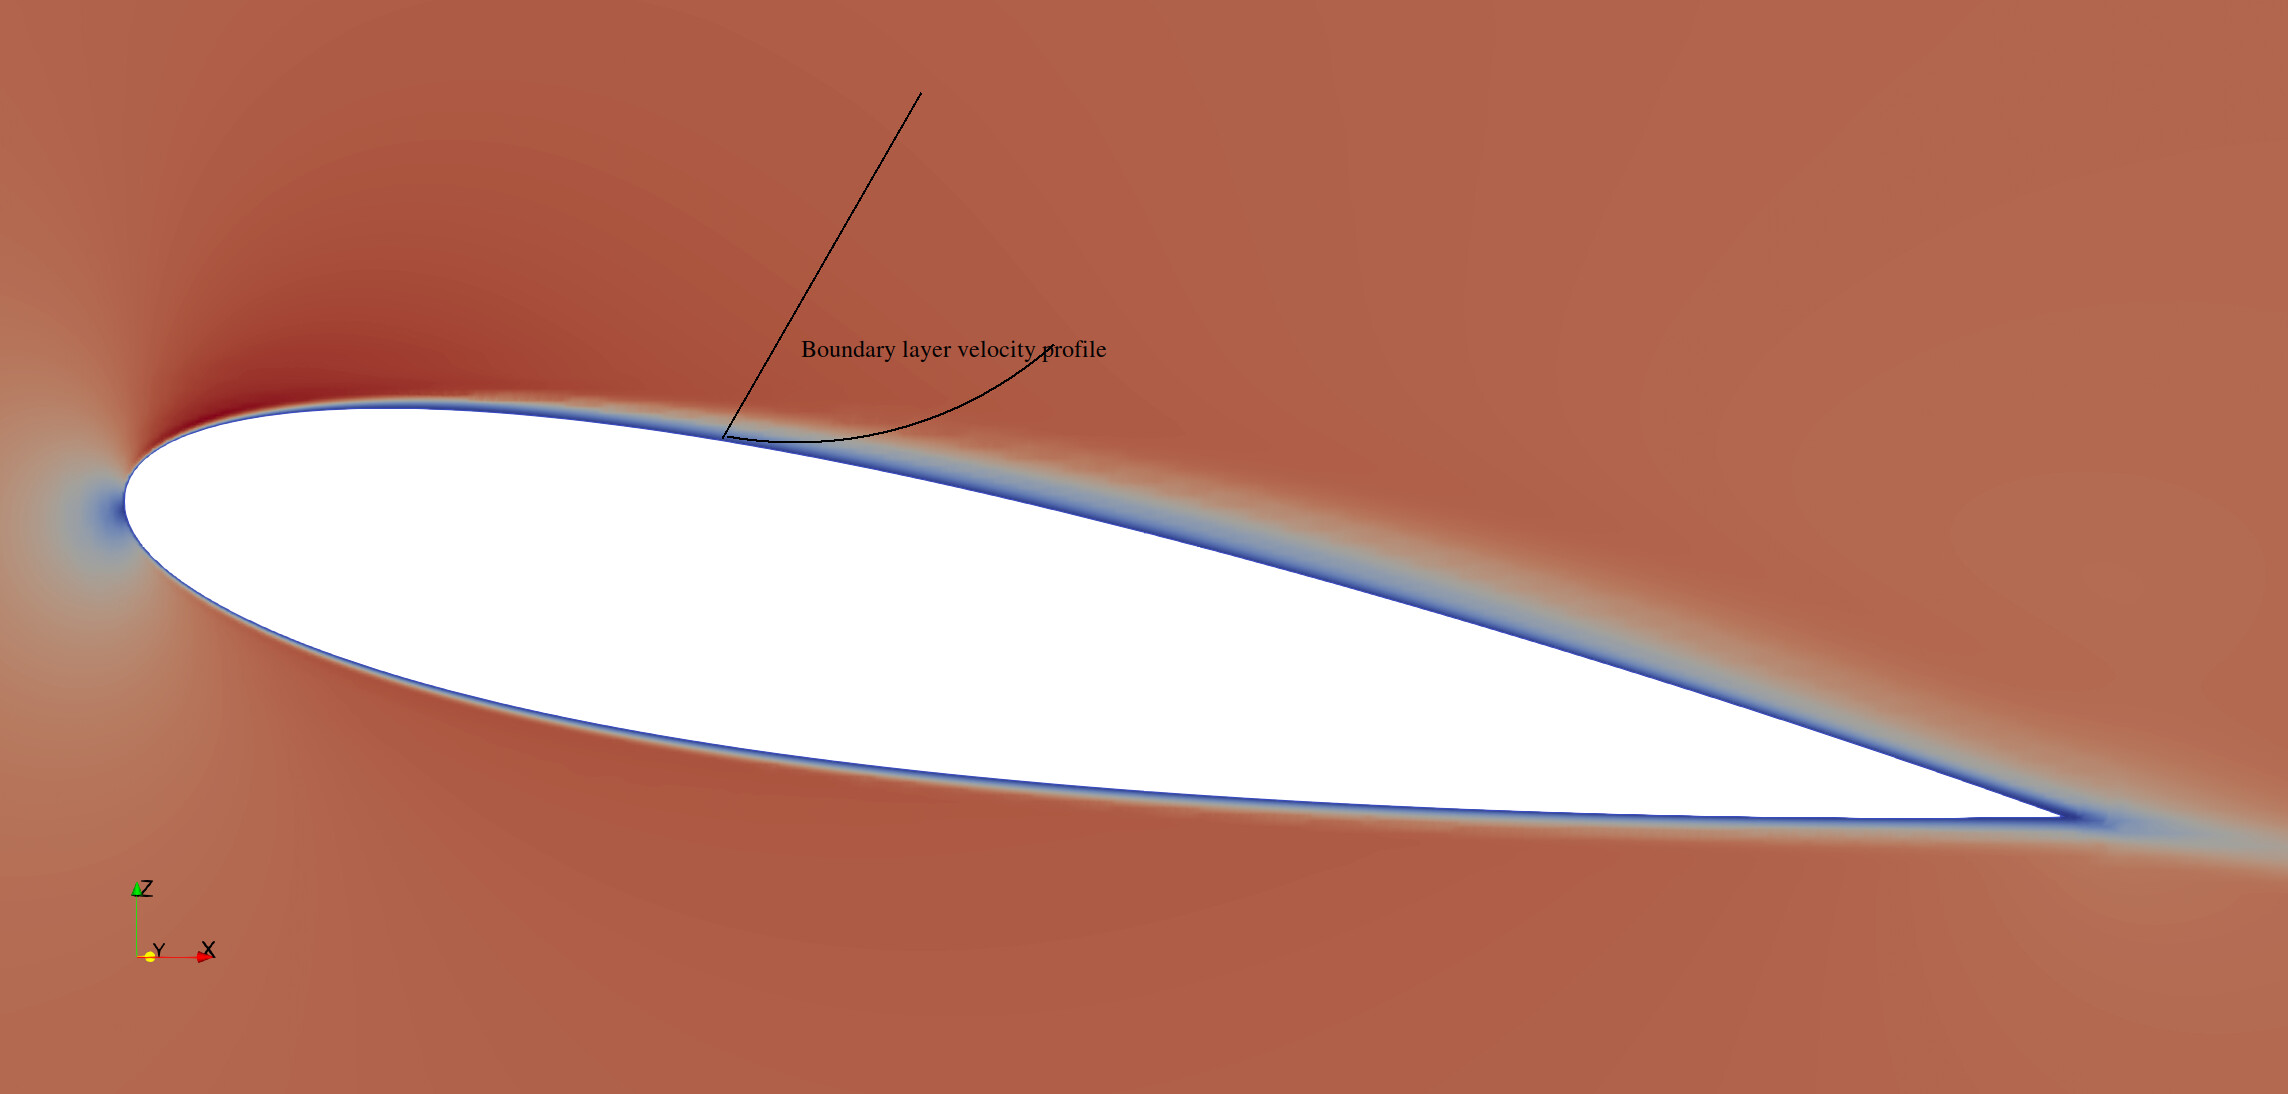
I tried to simulate a 3D NACA aerofoil in OpenFOAM. I want the velocity profile at different section of this aerofoil. To do that I need to average the velocity field in the span wise direction and then plot the velocity at different locations of the aerofoil. In the given figures: figure1 I have shown the 3D section of the aerofoil and to explicitly show what I mean by the span-wise direction; figure 2 is the contour plot of the 2D slice of the aerofoil in which I want to plot the velocity along a normal line to the surface of the aerofoil. So effectively I want to plot a velocity profile at a fixed location of aerofoil which is averaged in the spanwise direction. Is that can be processed in the ParaView, any suggestion or comments?

It’s not related to Paraview, but you can use this package within OpenFOAM to do what you want: https://github.com/ZmengXu/sampledPlaneAverage/tree/of7/sampledSurface/sampledPlaneSpanwise
Thanks a lot for the information and help. Just wondering will it be fine while running this utility with the OpenFOAM v1906. Would you mind to let me know-- how to incorporate/use it in OpenFOAM? Is this a postProcess utility? Sorry for asking so many questions. Thanks again for the help.
I am not the author of this code, so I do not know how can it be
compatible with v1906.
how to incorporate/use it in OpenFOAM?
The author wrote a blog about its mechanism and usage in his blog:
(in Chinese, you may use google translate to read)
You can download the code and compile by `wmake`. Then pay attention
to the following code when you add to your function:
    @@ -17,17 +17,19 @@
                 plane1
                 {
                     type sampledPlaneSpanwise;
                     interpolate    true;
                     planeType pointAndNormal;

                     pointAndNormalDict
                     {
    -                    basePoint (0 0 0.1);
    +                    basePoint (0 0 0.1);
    +//-wr                       ~~~~~~~~~~~~~~~~~~~
    +//-wr                       Set origin point of the cutting plane
                         normalVector (1 0 0);
                     }
                     nPoints    72;
                     spanwiseVector (0 0 1);
                 }

    @@ -18,17 +18,19 @@
                 {
                     type sampledPlaneSpanwise;
                     interpolate    true; // Must be true, or it just cut the plane do not do spanwise average.
                     planeType pointAndNormal; // method used to specific the cuttingPlane

                     pointAndNormalDict
                     {
                         basePoint (0 0 0.1);
    -                    normalVector (1 0 0);
    +                    normalVector (1 0 0);
    +//-wr                       ~~~~~~~~~~~~
    +//-wr                       Set the normal vector for the cutting plane
                     }
                     nPoints    72;
                     spanwiseVector (0 0 1);
                 }

    @@ -20,17 +20,19 @@
                     interpolate    true; // Must be true, or it just cut the plane do not do spanwise average.
                     planeType pointAndNormal; // method used to specific the cuttingPlane

                     pointAndNormalDict
                     {
                         basePoint (0 0 0.1);
                         normalVector (1 0 0);
                     }
    -                nPoints    72;
    +                nPoints    72;
    +//-wr                   ~~~~~~~~~~~~~~
    +//-wr                   how to set the distance between two sampling planes?
                     spanwiseVector (0 0 1);
Just adding the above code to your case setup and do modification
accordingly. You can follow the follwoing example:
$FOAM_TUTORIALS/incompressible/pisoFoam/LES/motorBike/motorBike/system/streamLines
Is this a postProcess utility?
Yes, you can use that way to execute functionObjects after your
calculation is done. Here’s what a functionObjects looks like.
Class
Foam::functionObjects::FUNCTIONOBJECTDescription
This function object…Example of function object specification:
\verbatim
FUNCTIONOBJECT1
{
type FUNCTIONOBJECT;
libs (“libFUNCTIONOBJECTFunctionObject.so”);
…
wordData someWord;
scalarData 1.0;
labelData 1;
}
\endverbatimUsage
\table
Property | Description | Required | Default value
type | type name: FUNCTIONOBJECT | yes |
wordData | some word option… | no | defaultWord
scalarData | some scalar value… | yes |
labelData | some label value… | yes |
\endtable
However, you can also make it to run while the simulation is running,
which you can sample the data at higher frequency.
Hello,
Many thanks for your detailed answers. I tried to run the “code” in the OpenFOAM v1906, but it gave the following error (file is attached). I think some compatibility issues are there, could you kindly help. Do you suggest to install the OpenFOAM 4?
spanwise_error.txt (11.1 KB)
It looks like it does not support v1906. I am afraid that I could not help
you right away. But porting data from v7 to v1906 is something that I
would like to study as well.
If you do not have time to play with, I suggest you just slice 10
planes along the span-wise direction by creating a simple python script
to cut one plane and then extend that script to 10. The tool you may
start with is Tools → Start Tracer.
Meanwhile, this is a forum for ParaView not for OpenFOAM, so if you
are still interested in using native OpenFOAM code to generate such a
span-wise average function, we can discuss in this repo. I recently
also play with naca0012.
Thanks a lot for your help and support. You are absolutely correct about the validity of the forum. I am afraid that I digested your suggestions completely. I will continue asking you asking on your new forum, hope you won’t be offended, thanks again for your kind cooperation.
Hi again,
Really excited to start working with the Python scripts in Paraview. Using your suggestion
I sliced one plane and using Tools – Start Tracer saved the Python script and then re run that script to get the same figure again, till this point I was able to understand and did that successfully, many thanks to you. But sorry I don’t understand what needs to be done afterwards, any further clue? Sorry for asking many question but believe me this is my first Python script in Paraview which I was very excited to learn. Thanks again for all your wonderful comments and suggestions.