Work-around
@utkarsh.ayachit, you’re absolutely correct that we can set the axis labels explicitly. I suppose I should have mentioned that I have a few macros/pvpython scripts set up to handle general axis label specification. These two functions work to take the name of a data source on the pipeline and sets the axis labels at defined intervals for that datasets bounds. (these are macros I made for PVGeo’s pvmacros python module)
def setAxisLabelsFromBounds(name, num=(10, 10, 5)):
    """Sets the axis labels from a given input data source. Use the num argument
    to control the number of labels along each axis. If num is a scalar, then
    a uniform number of labels is used on each axis.

    Author: Bane Sullivan <http://banesullivan.com>

    Originally implemented for PVGeo <http://pvgeo.org>

    Args:
        name (str): The string name of the input source on the data pipeline
        num (tuple(int) or int): the number of labels for each axis

    Example:
        >>> import pvmacros as pvm
        >>> pvm.vis.setAxisLabelsFromBounds('TableToPoints1', num=(5, 10, 2))

    """
    import paraview.simple as pvs
    import paraview.servermanager as sm
    import numpy as np
    # Get the input data
    src = pvs.FindSource(name)
    data = sm.Fetch(src)
    xmin,xmax, ymin,ymax, zmin,zmax = data.GetBounds()
    if not isinstance(num, (tuple, list)):
        num = list(num)
    # Cast as ints if needed
    for i, val in enumerate(num):
        if not isinstance(val, int):
            num[i] = int(val)
    # Calculate ranges for each axis
    xrng = np.linspace(xmin, xmax, num=num[0])
    yrng = np.linspace(ymin, ymax, num=num[1])
    zrng = np.linspace(zmin, zmax, num=num[2])

    # Set the axis labels
    customAxisTicks(xrng, axis=0, uniform=False)
    customAxisTicks(yrng, axis=1, uniform=False)
    customAxisTicks(zrng, axis=2, uniform=False)
    return

def customAxisTicks(rng, axis=0, uniform=False):
    """Use to set custom axis ticks in the render view

    Args:
        rng (list(float)): A list or tuple of floats for the axis ticks
        axis (int): The axis to set (X=0, Y=1, or Z=2)
        uniform (bool): An optional flag to use the given range on all axii
    """
    from paraview.simple import GetActiveViewOrCreate, RenderAllViews
    # note that third parameter is the step size
    # get the active view
    rv = GetActiveViewOrCreate('RenderView')
    if axis is 0 or uniform:
        rv.AxesGrid.XAxisUseCustomLabels = 1
        rv.AxesGrid.XAxisLabels = rng
    if axis is 1 or uniform:
        rv.AxesGrid.YAxisUseCustomLabels = 1
        rv.AxesGrid.YAxisLabels = rng
    if axis is 2 or uniform:
        rv.AxesGrid.ZAxisUseCustomLabels = 1
        rv.AxesGrid.ZAxisLabels = rng
    RenderAllViews()
    return None
Example
@mwestphal, I do not have many datasets that I can share… but I have created a state file of some vtkImageData of Landsat imagery which can be downloaded here: https://www.dropbox.com/s/ahe9gth93nre7ks/discourse-example.zip?dl=0
Note: the vtkImageData has an RGB array of a false color scheme so make sure Map Scalars is off to see the false color image.
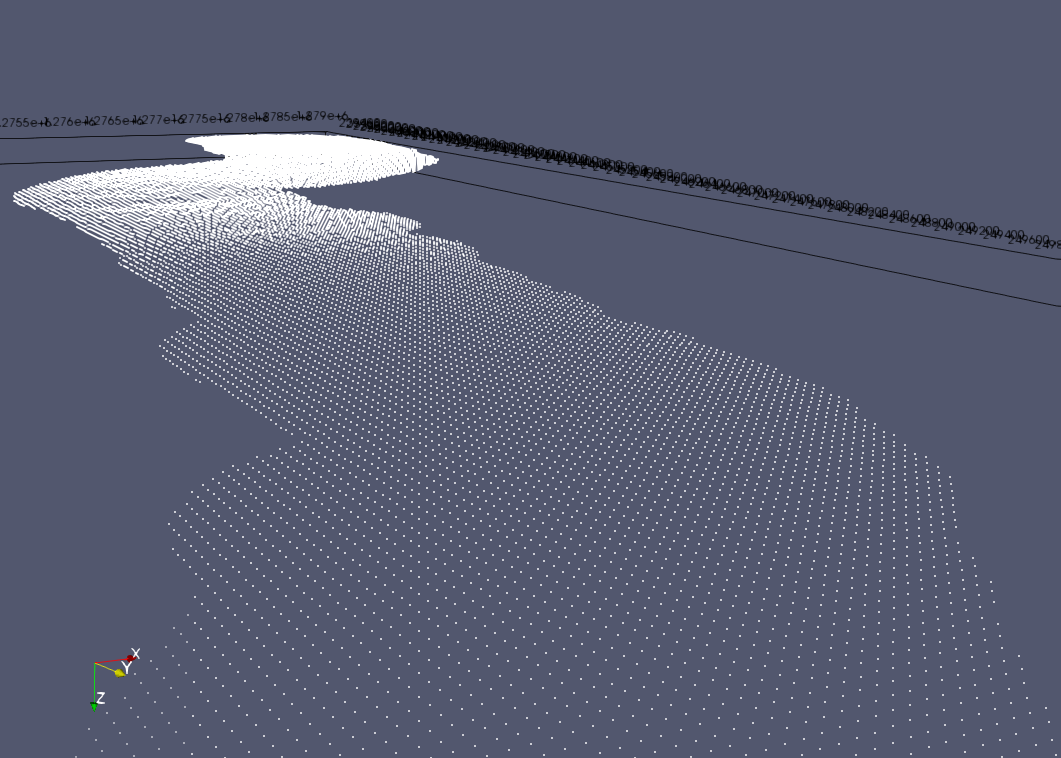
and a screenshot of the axis labels: