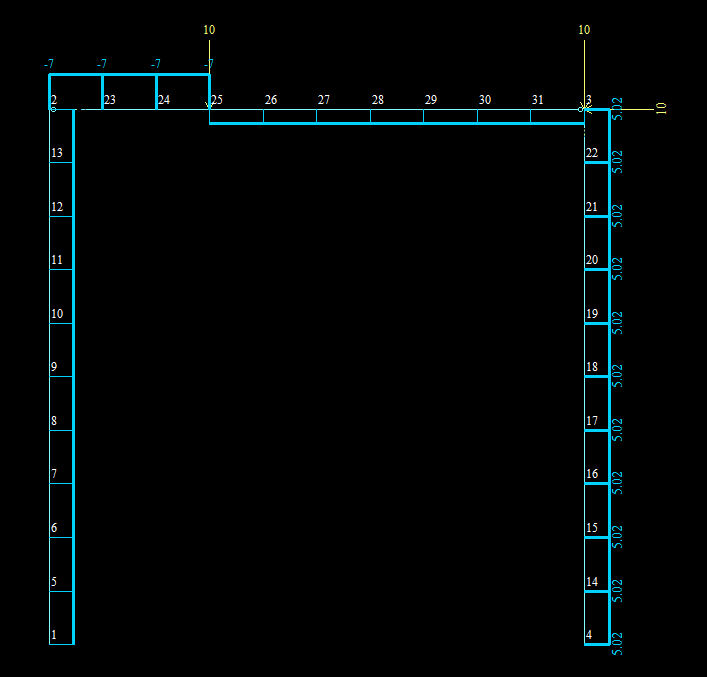
Hello. Is there some features in paraview which allow to display moment or force diagrams for line elements like on the picture below?

There is not functionality specifically aimed at moment/shear diagrams, but it should not be difficult to script by
- subdividing your line elements and
- using Warp Scalar or Warp Vector to deform the source geometry scaled by the moment or shear.
The only complications you may run into with line elements is that you will need to define the direction along which to apply the deformation since line elements do not have a unique normal vector (there are infinitely many vectors perpendicular to a curve at any point along it).
Hello. @dcthomp this is my file:
beam_forces.pvsm (526.2 KB)

I try to plot top lite of diagram by Warp by Scalar but it didn’t appears.
Help me please.
May be somebody knows solution for this problem?
Please share your data.
Hello, @mwestphal.
beam_forces.pvsm (526.2 KB)
assembly_test_out.e (118.3 KB)
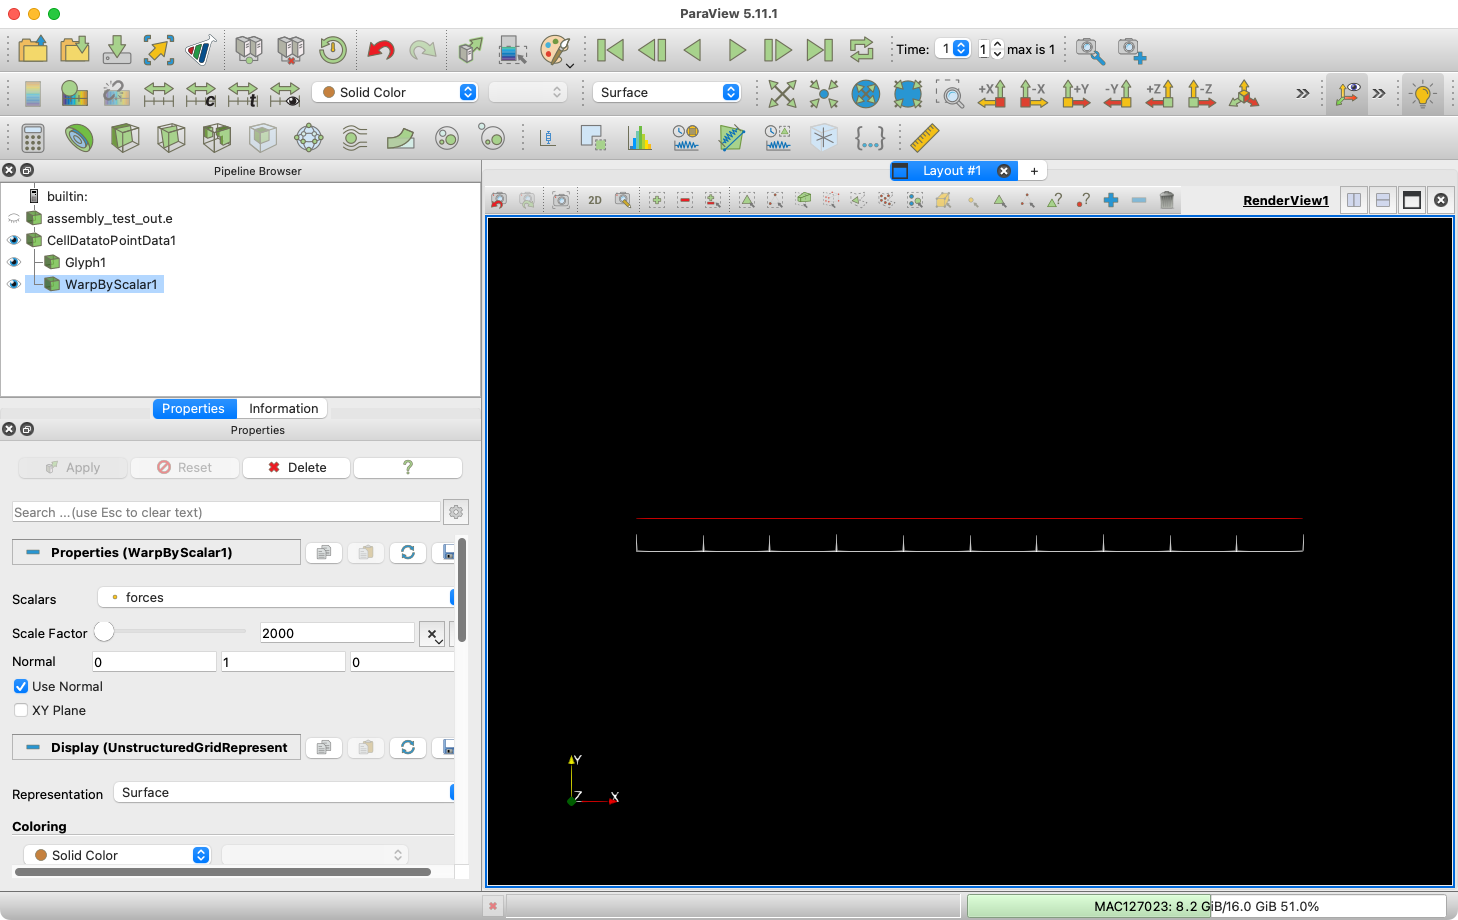
The filter is warping your data by a scalar, but there are a couple of reasons why you don’t see it.
The first problem is that you have set the Normal vector in Warp By Scalar to [0, 0, 1], which is pointing in the Z direction. ParaView saw that your data is flat so is showing you the data in 2D projection mode. The displacement is happening straight out of the image, but because you are in 2D (parallel) projection, you have no hope of seeing changes in that direction.
The second problem is that your displacement is very small. The bounds of the data in the x direction is 4, but the displacement everywhere is about 0.0001. This is too small to see even if it was in the right direction. You need to bump the Scale Factor up to the thousands to clearly see the displacement.
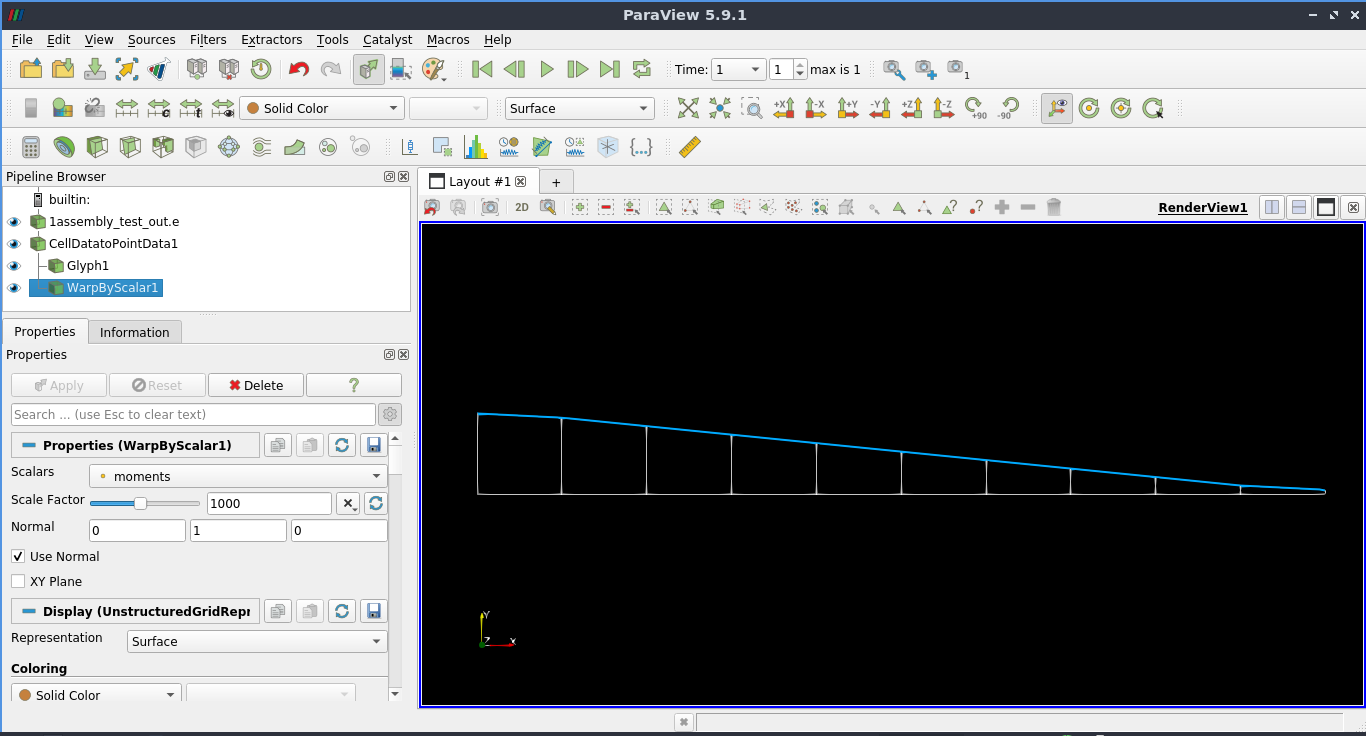
Here is a state that makes them visible.
beam_forces_corrected_warp.pvsm (570.2 KB)
Thank you @Kenneth_Moreland . Now it looks fine.
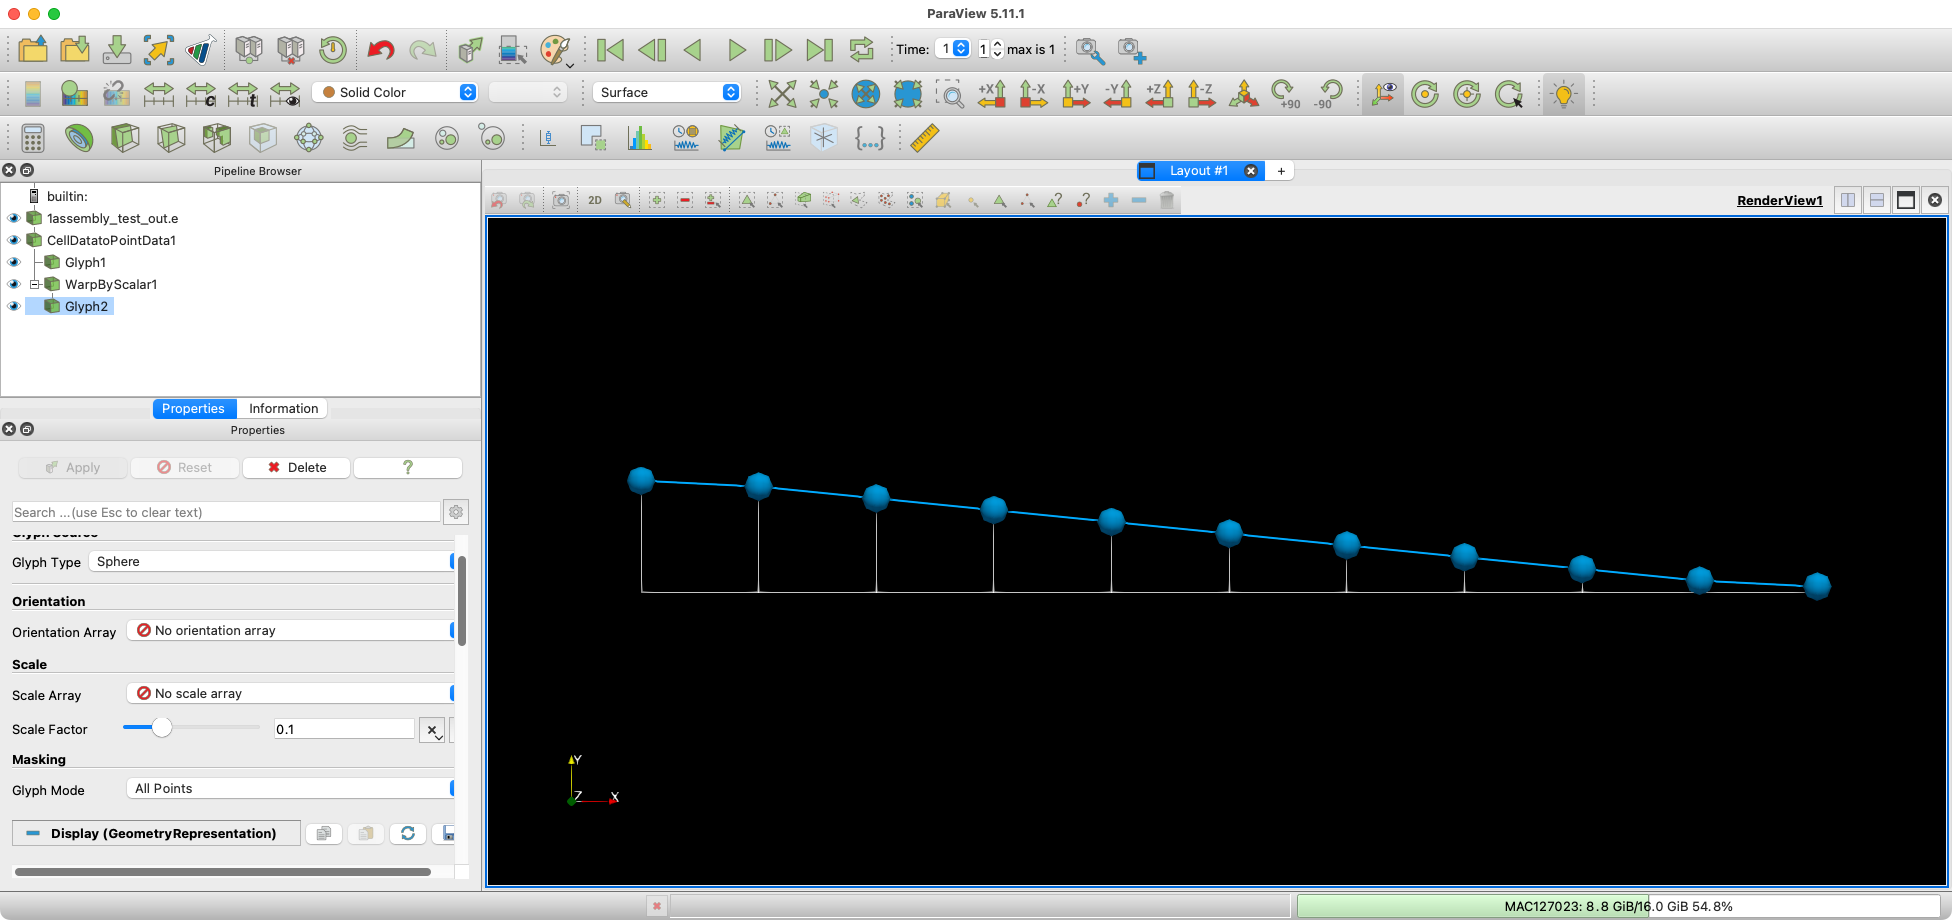
Maybe you also now how to plot values at nodes above the blue line?
1assembly_test_out.e (122.3 KB)
beam_moments.pvsm (555.1 KB)
Thank you @Kenneth_Moreland, but i meant values of the moment at each node like here:
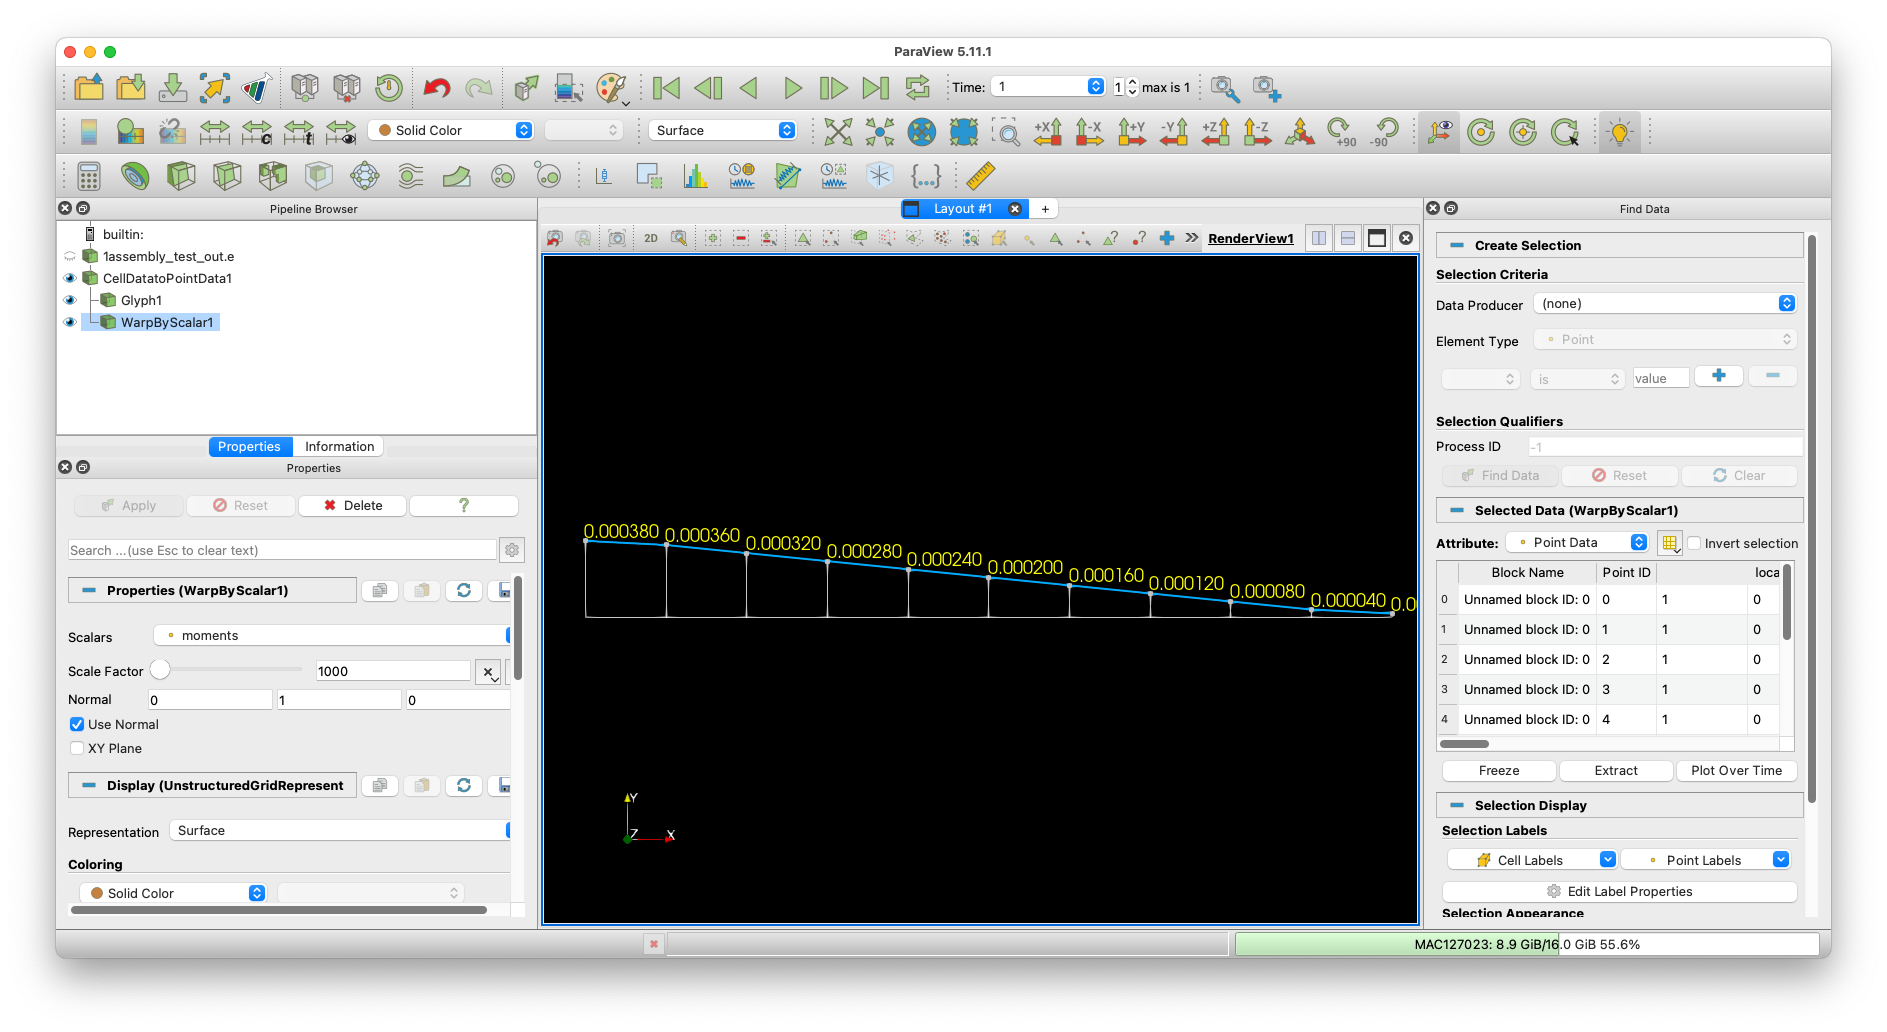
Thank you @Kenneth_Moreland . It is that i need.
But in some cases, for example if shear force applied to the node a gap occurs at diagram.
Is it possible to build such diagram for each element separately?
You cannot do that automatically, but you can place labels like that by hand using the Text source and putting it into flagpole mode.
beam_moments_flagpole_text.pvsm (609.1 KB)


I don’t understand what you are trying to do. Some lines go up, some go down. Some are red, some are blue, some are yellow. The data you shared does not match the diagrams you are posting. I don’t really know what you are trying to accomplish.
Excuse me, @Kenneth_Moreland .
You are right, existing data is not enough to do it. If i will make updated .e file i will share it.