Hi!
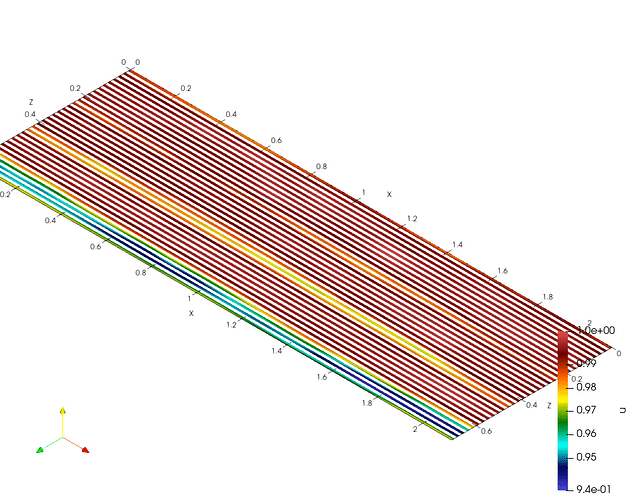
I have a code that is parallelized in the z direction (32 process), and i’m interested in ploting all the information together without communicate it inside the code, this mean: each process produces it’s own .vtk file. Is there a way to plot the information without the blank spaces that are appearing between the data, without translate every single process manualy?
Ps: I’m using the filter Group DataSets to see the evolution over time of the simulation.
Thanks you!
0_PlanoXZy106_220000.vtk (16.1 KB)
1_PlanoXZy106_220000.vtk (16.1 KB)
2_PlanoXZy106_220000.vtk (16.1 KB)
3_PlanoXZy106_220000.vtk (16.1 KB)
4_PlanoXZy106_220000.vtk (16.1 KB)
6_PlanoXZy106_220000.vtk (16.1 KB)
7_PlanoXZy106_220000.vtk (16.1 KB)
8_PlanoXZy106_220000.vtk (16.1 KB)
9_PlanoXZy106_220000.vtk (16.1 KB)
10_PlanoXZy106_220000.vtk (16.1 KB)
11_PlanoXZy106_220000.vtk (16.1 KB)
12_PlanoXZy106_220000.vtk (16.1 KB)
13_PlanoXZy106_220000.vtk (16.1 KB)
14_PlanoXZy106_220000.vtk (16.1 KB)
15_PlanoXZy106_220000.vtk (16.1 KB)
16_PlanoXZy106_220000.vtk (16.1 KB)
17_PlanoXZy106_220000.vtk (16.1 KB)
18_PlanoXZy106_220000.vtk (16.1 KB)
19_PlanoXZy106_220000.vtk (16.1 KB)
20_PlanoXZy106_220000.vtk (16.1 KB)
21_PlanoXZy106_220000.vtk (16.1 KB)
22_PlanoXZy106_220000.vtk (16.1 KB)
23_PlanoXZy106_220000.vtk (16.1 KB)
24_PlanoXZy106_220000.vtk (16.1 KB)
25_PlanoXZy106_220000.vtk (16.1 KB)
26_PlanoXZy106_220000.vtk (16.1 KB)
27_PlanoXZy106_220000.vtk (16.1 KB)
28_PlanoXZy106_220000.vtk (16.1 KB)
29_PlanoXZy106_220000.vtk (16.1 KB)
30_PlanoXZy106_220000.vtk (16.1 KB)
31_PlanoXZy106_220000.vtk (16.1 KB)
