Hi all
I’m looking for xticks/minorgridlines/bounding ruler type options for plotting 1D Lineplots. For example: for a 1D Finite Volume problem say, I want to represent the ends of each cell (My need is slightly more complicated though) . I’m looking for ways to for example, create custom minor gridlines in ydirection(perp to xaxis), so I can pick the divisions=no. of cells, to represent the cell ends.
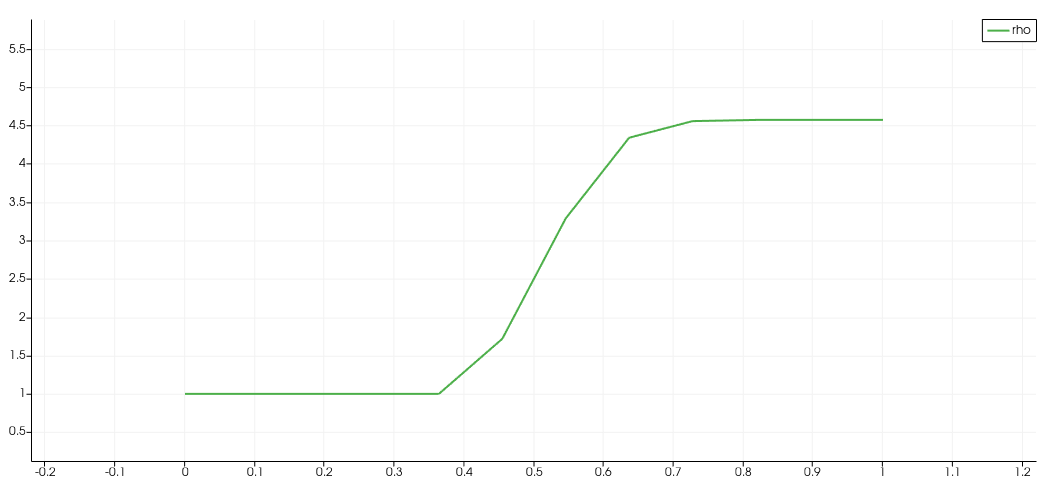
Simply speaking, in the below screenshot of Lineplot, if you can notice the boxes made the gridlines in x and y directions, I basically want to choose number of those boxes in x directions.
I know I can add custom labels to Bottom axis, but I need a way to do this for a large number of uniformly distributed divisions, I’m looking for a quick easy way instead of manually adding each custom label
Could you elaborate please?, I don’t understand. For instance say in the xrange of 0-1 I need 11 custom labels, 0.0,0.1 0.2,0.3,0.4…,1.0, how would we do this, with the method you suggested?
I don’t actually, any easy way to create in paraview directly?(Given I know some details like as specified in the above example-(0.0,0.1,0.2,…,1.0),etc). We cant get such data from plot over line right? I use legrange hexadron type cells.