Hello,
Maybe there is not 3D plots in ParaView:
https://discourse.paraview.org/t/plotting-points-on-a-rectangular-grid-with-paraview/3146
Therefore, I tried to use a Programmable Source with your data, but it was a bit complicated. (state file is here: 3d_plot.pvsm (298.2 KB) )
-
Set the Output Data Set Type to vtkImageData under the Programmable Source Properties.
-
Declare the extent in Script (RequestInformation).
from paraview import util
util.SetOutputWholeExtent(self, [0, 3000, 0, 50, 0, 0])
- Load the data and assign them to the source output as a field data in Script. You need to modify “Path/To/Data/Folder”.
import numpy as np
from io import StringIO

output.SetDimensions(3001,51,1)
output.SetSpacing(1,60,1)

file_name = 'Path/To/Data/Folder/data_1.txt'

# remove \t at the end of sentence
file = open(file_name,'r')
string = file.read()
file.close()
string = string.strip('\t')
string = StringIO(string)

data = np.loadtxt(string)
print(data.shape)

output.PointData.append(data.flatten(), 'data_1')
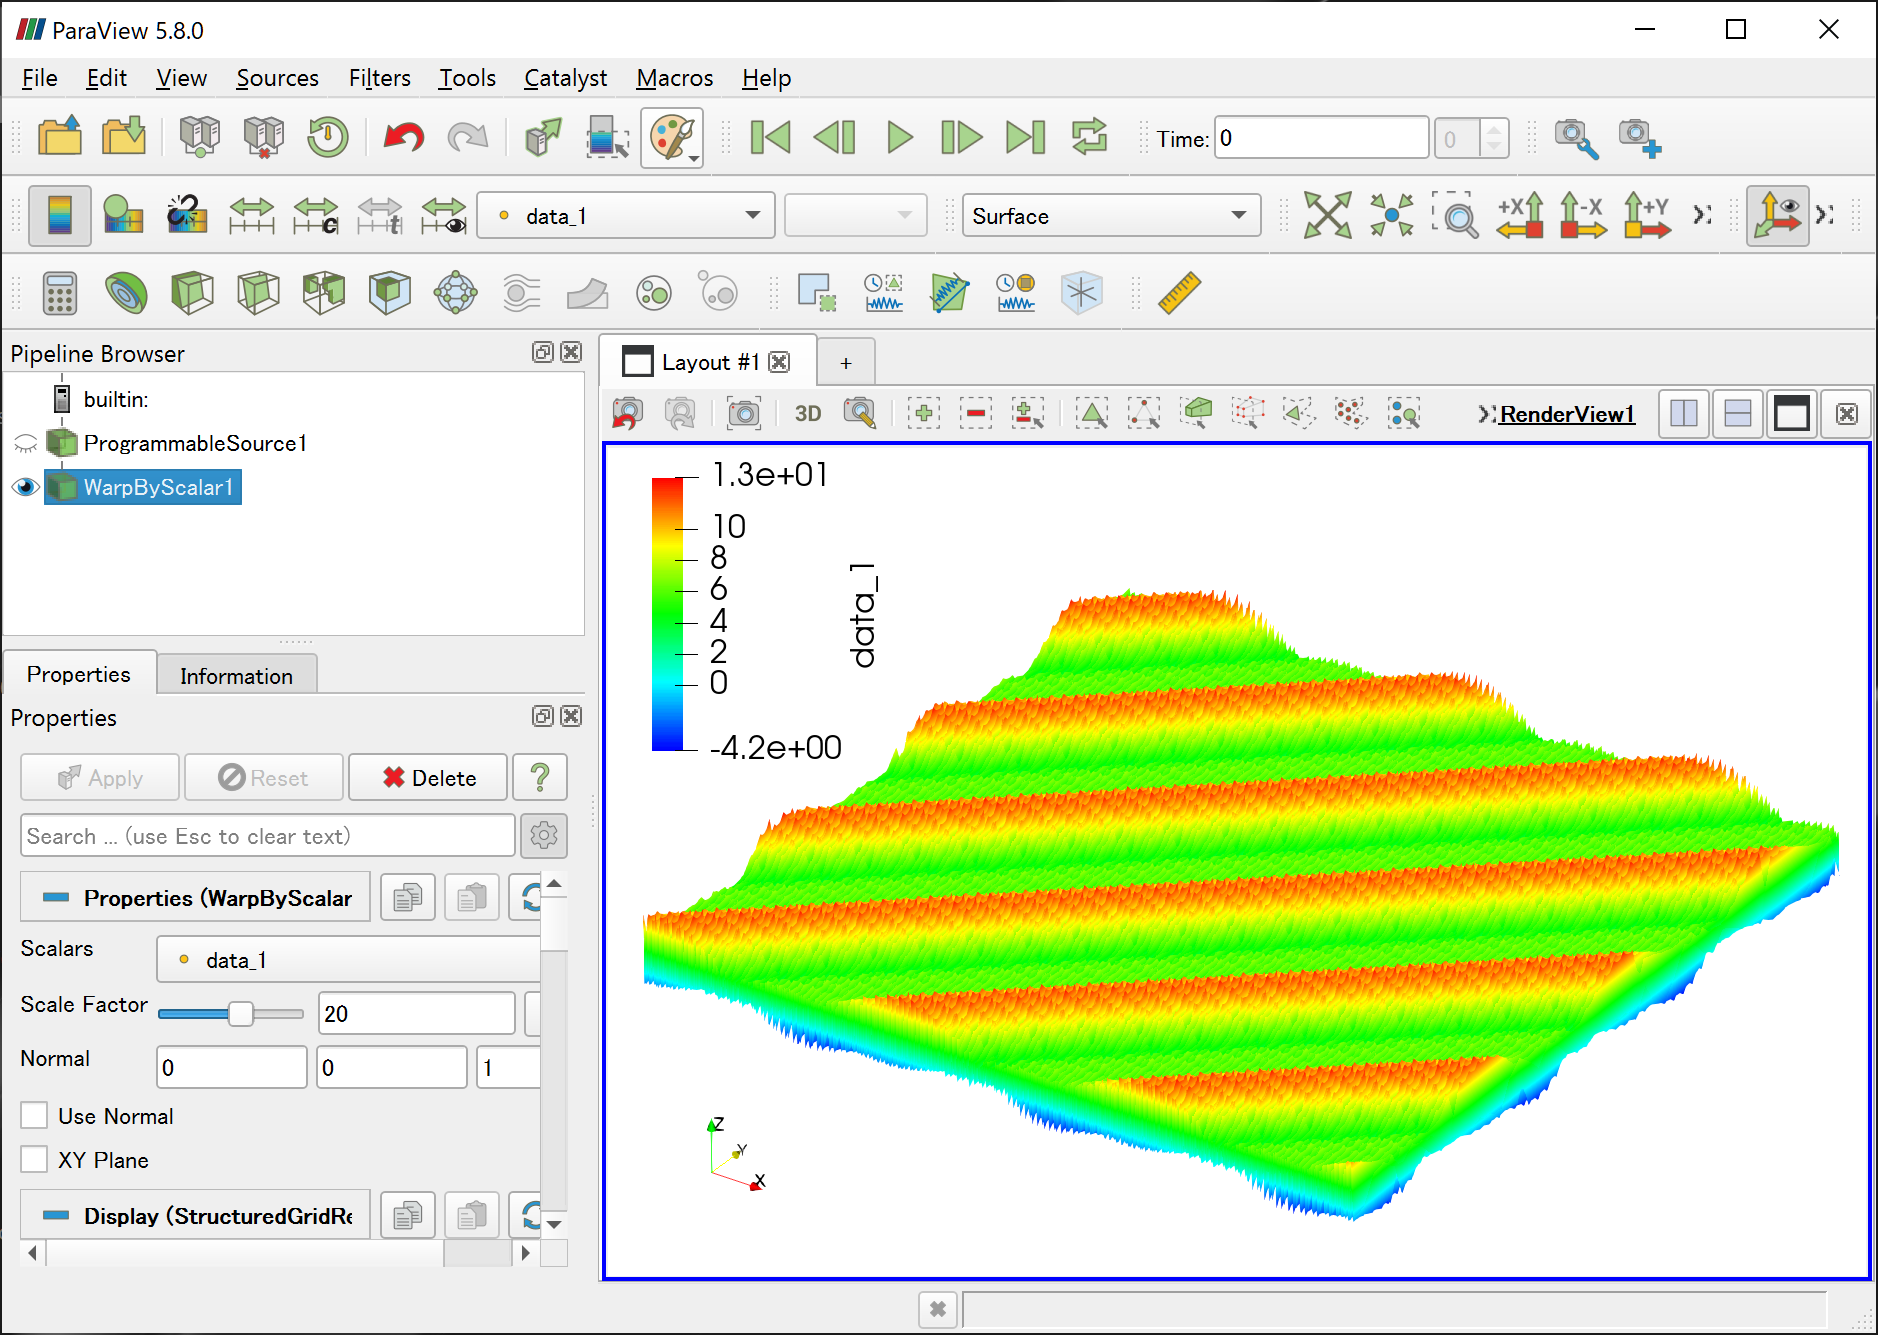
- Apply the Warp by Scalar filter.