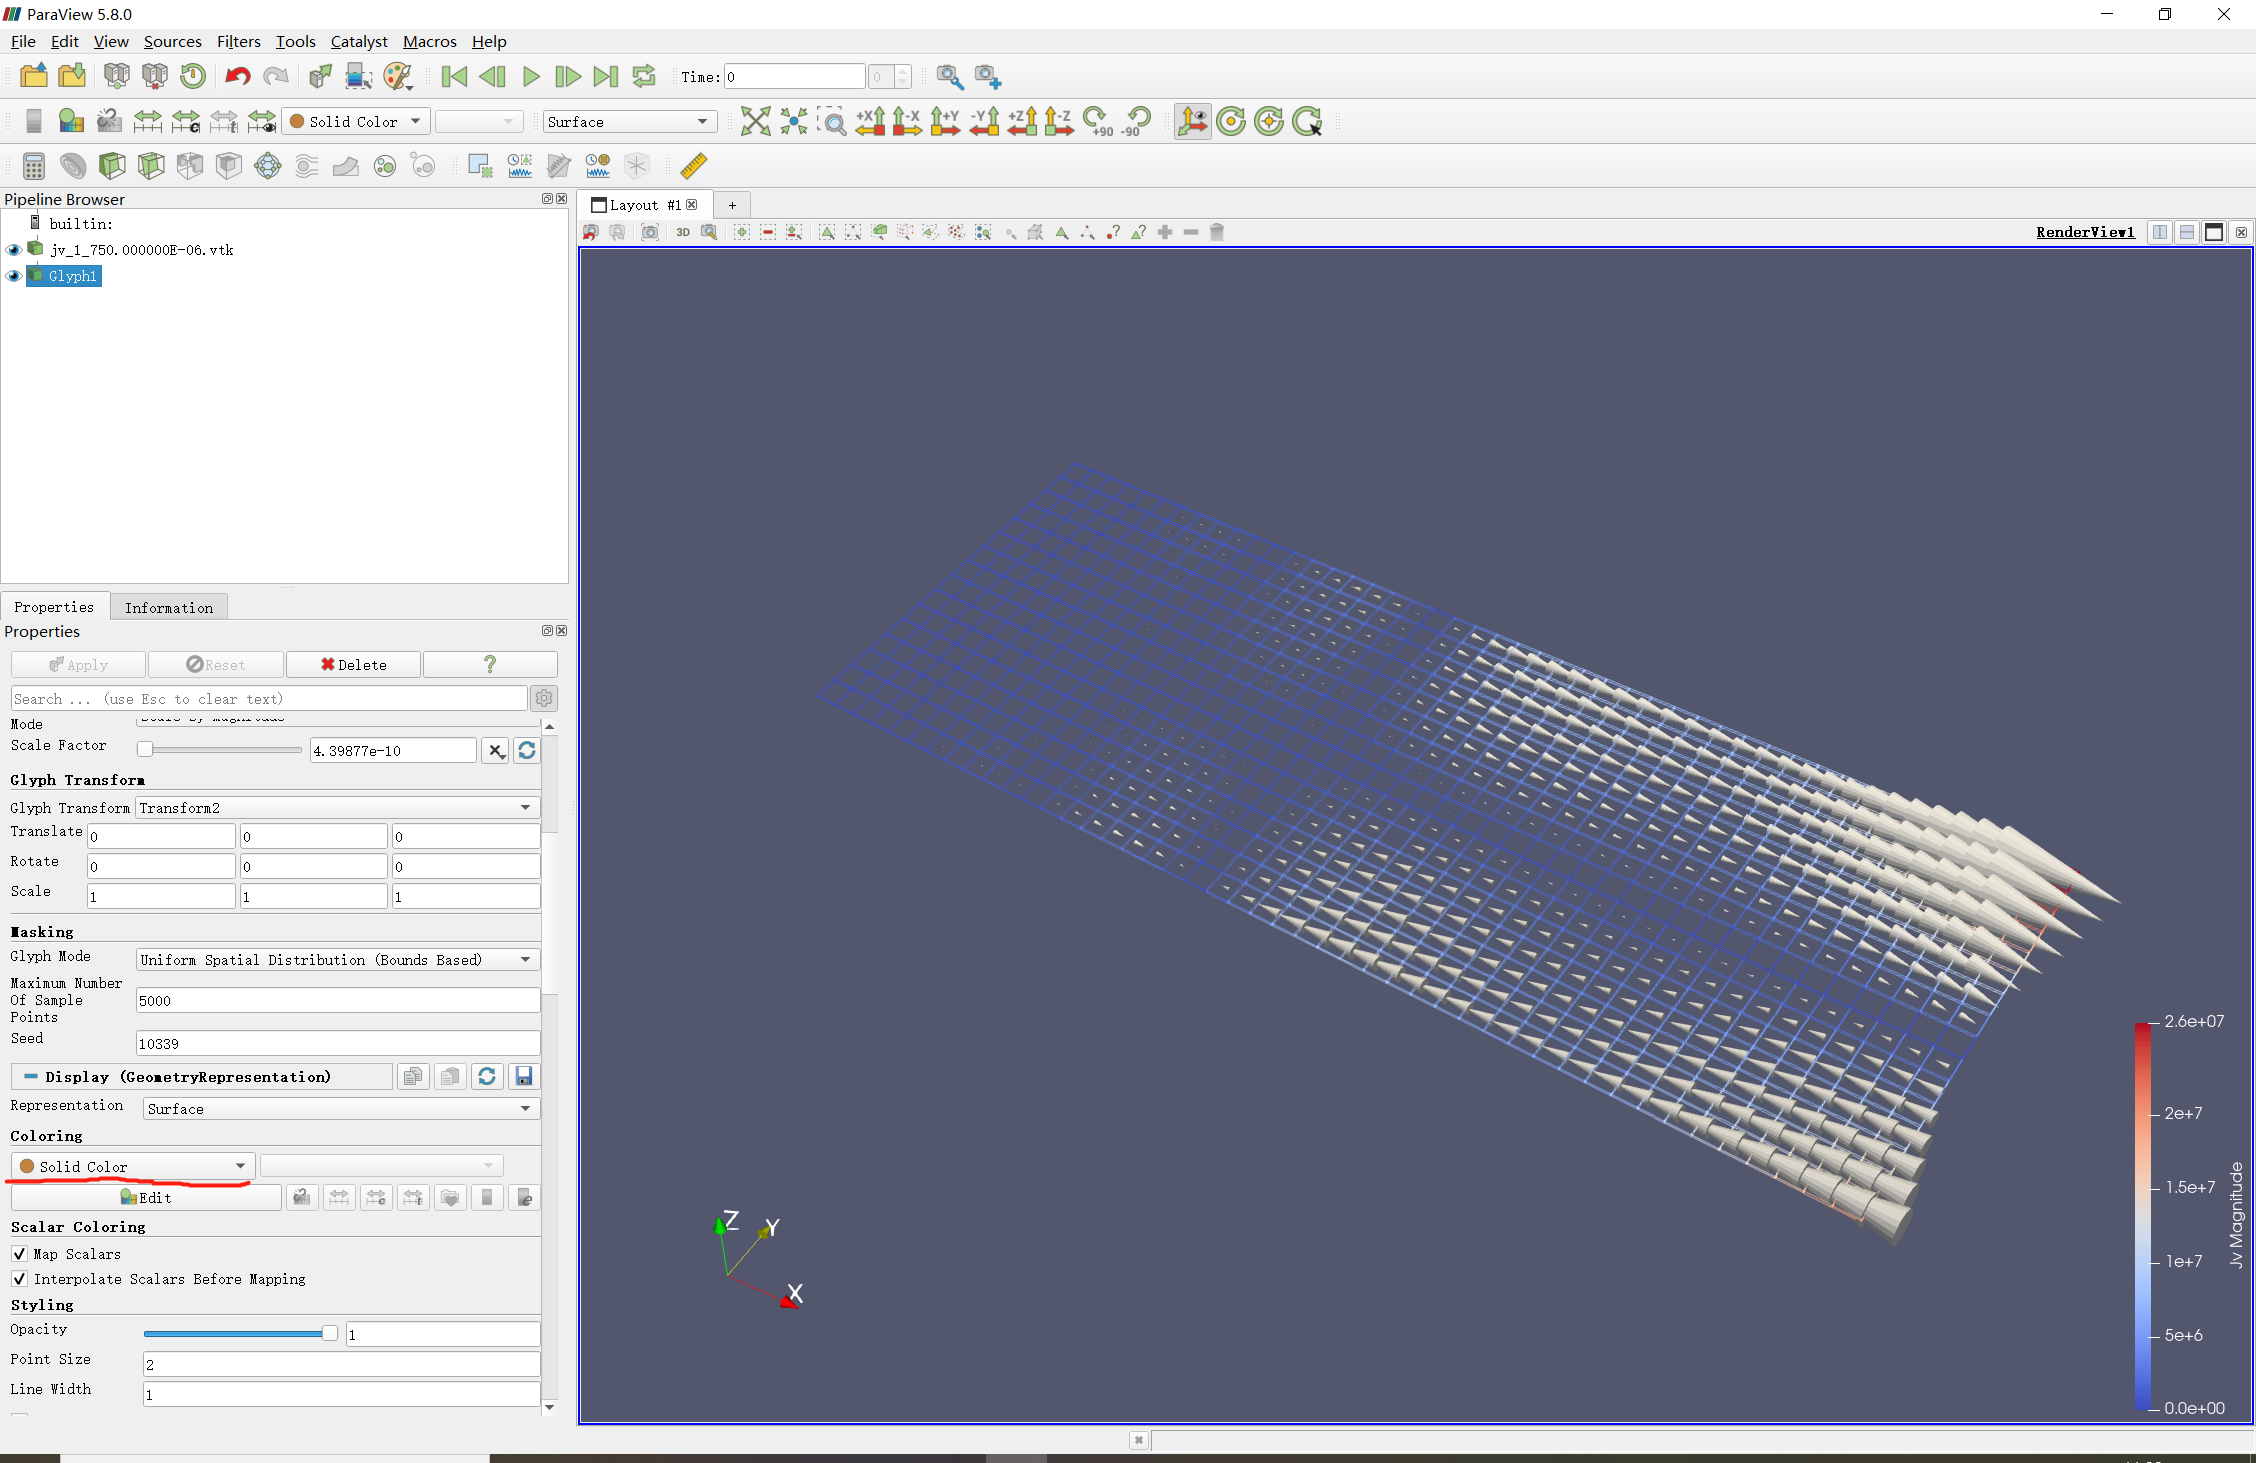
I used the Paraview 5.8.0 to display the current density by Glypg filter, but I can’t color the glyph according to the cell data. There is no other option but ‘solid color’ in the coloring menu. I remember in the old version I can choose the color of glyph directly in this menu.
Its been fixed 3 years ago. Your issue is different and may be related to your data. Indeed, one of your cell contain a Point index of value -1, which is invalid.
I guess I don’t understand the connectivity and offsets arrays then. I wanted to define 2 cells: the first cell contains 2 vertices (indices 0 and 1), the second cell just contains 1 vertex (index 2).
If I’m following this thread, you (@Randy_Heiland) are loading a dataset with poly-vertex cells, running the Glyph filter, and trying to color by a cell field that was on the original data. The problem is that the Glyph filter is not passing the cell data.
This is because the Glyph filter is creating glyphs on the points, which is the normal mode of the filter. When creating glyphs on the points, only the point data fields are passed to the output. This is because in general cells can share points so the appropriate cell field value is ambiguous.
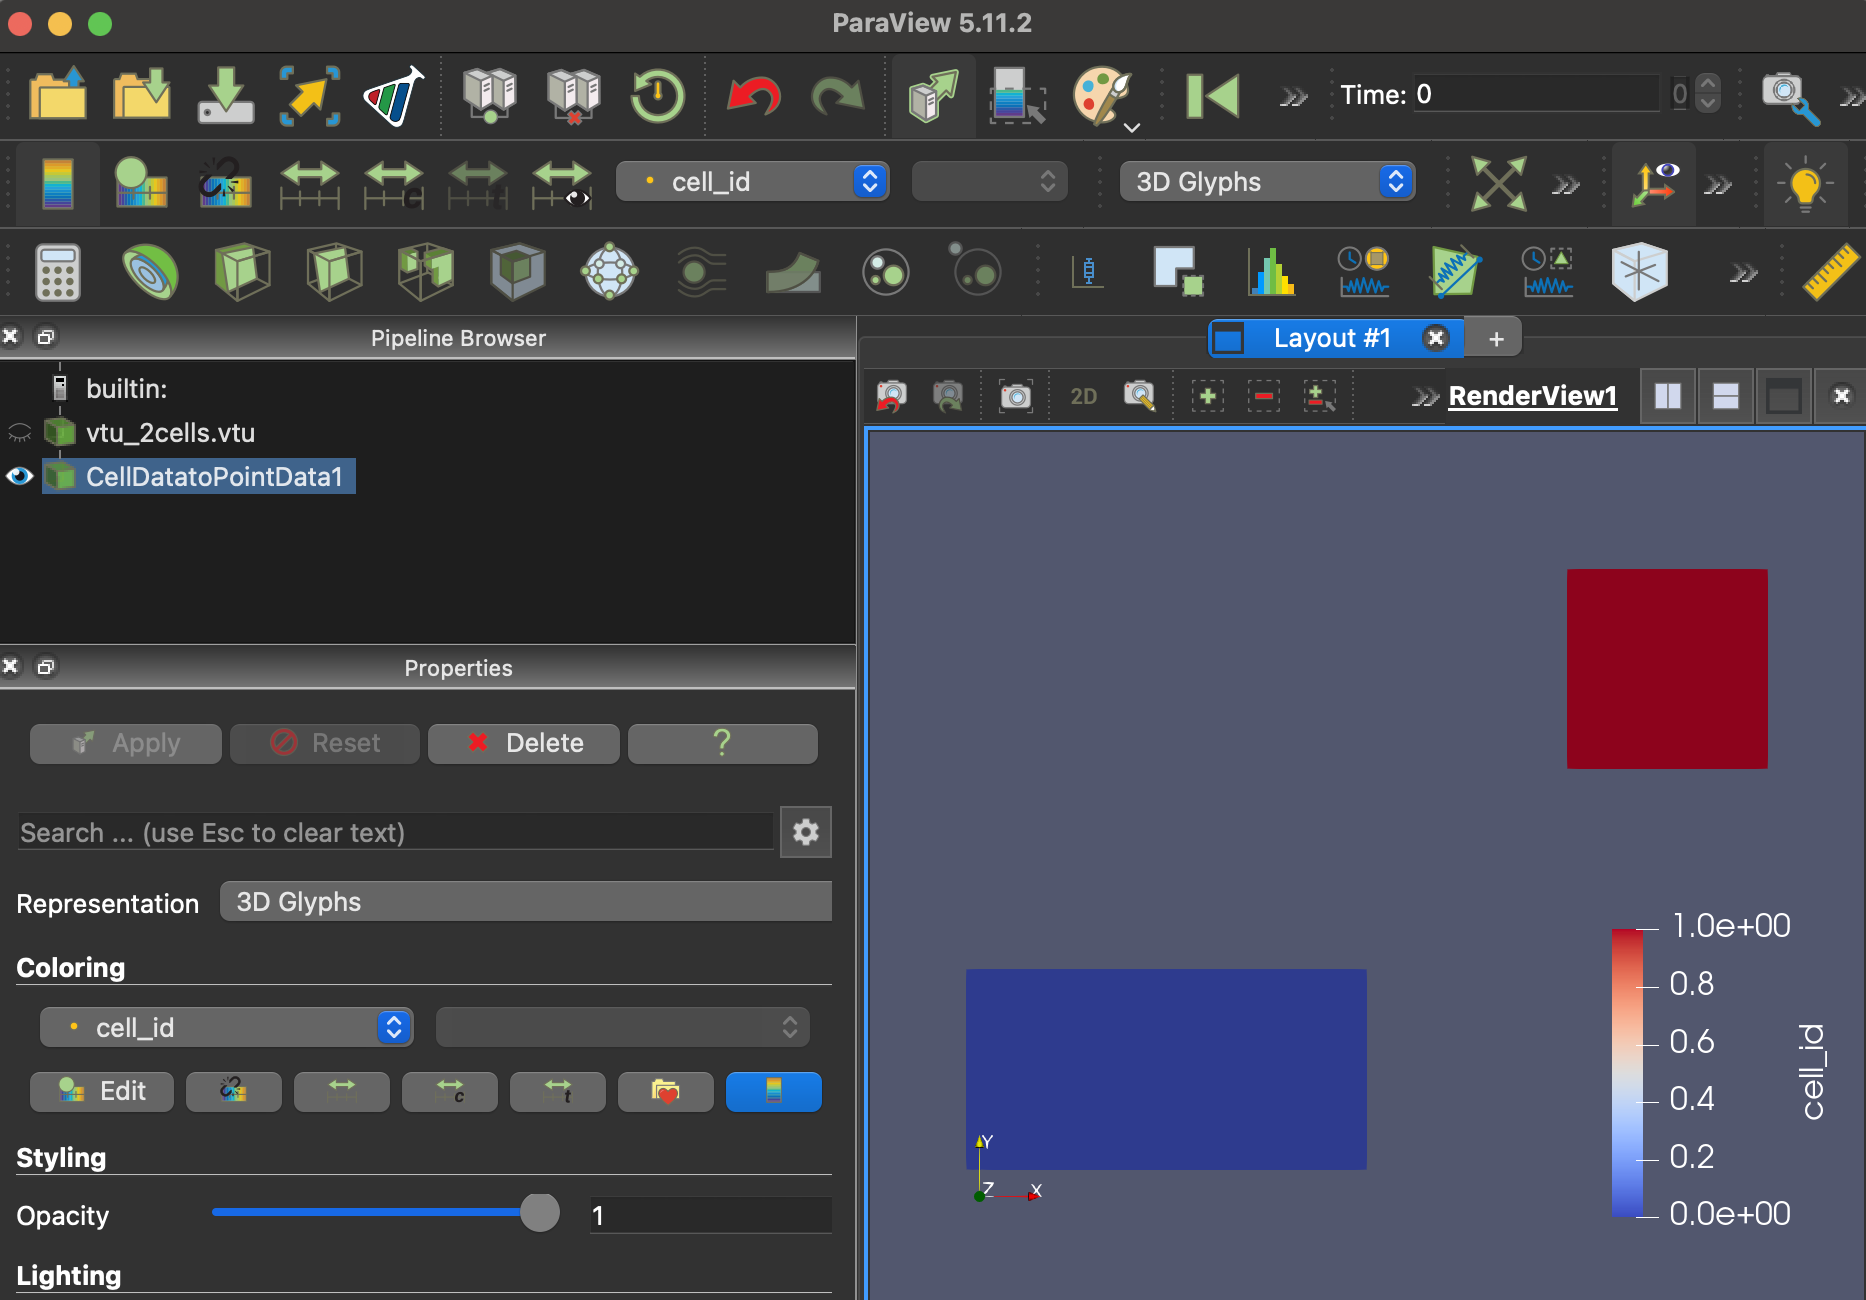
There are three workarounds to this problem. The first workaround is if you want to have a glyph over every point/vertex in your data (in your example, 3 total), then just run the Cell Data to Point Data filter before the Glyph filter. If none of your cells share points, then the cell data will just get copied to the points where it can then be passed by the Glyph filter.
The second workaround is if you want to have a single glyph for every cell you have defined (in your example, 2 total), then you can use the Cell Centers filter before the Glyph filter. This essentially converts each cell to a single point, and your cell field will be converted to a point field that the Glyph filter will pass.
The third workaround produces a similar result as the second workaround by forcing the Glyph filter to create glyphs on cells instead of points. There is no direct way to do this (as far as I know), but the filter will change to cell mode if you select a cell field for either the Scale or Orientation (or both). The data you provided does not have a cell field that is appropriate to either, but you can add one by using the Calculator to create a cell field filled with 1. Scale the glyphs by that, and the Glyph filter will pass your cell fields to the output.
Thanks for that terrific explanation. And I did indeed figure out the first workaround that you mentioned (attached). My slightly annoying and probably naive request for PV would be to detect that the pipeline is attempting to use Glyphs, but has selected a scalar array that’s associated with CellData, and popup a warning if the CellDataToPointData is not present. Anyway, thanks very much for everyone taking time to respond!
As background, fyi, what I’m really trying to do is come up with a meaningful, common data format that can represent multiple agent based modeling formats. Perhaps I’ll say more later.