Dear Paraview Support,
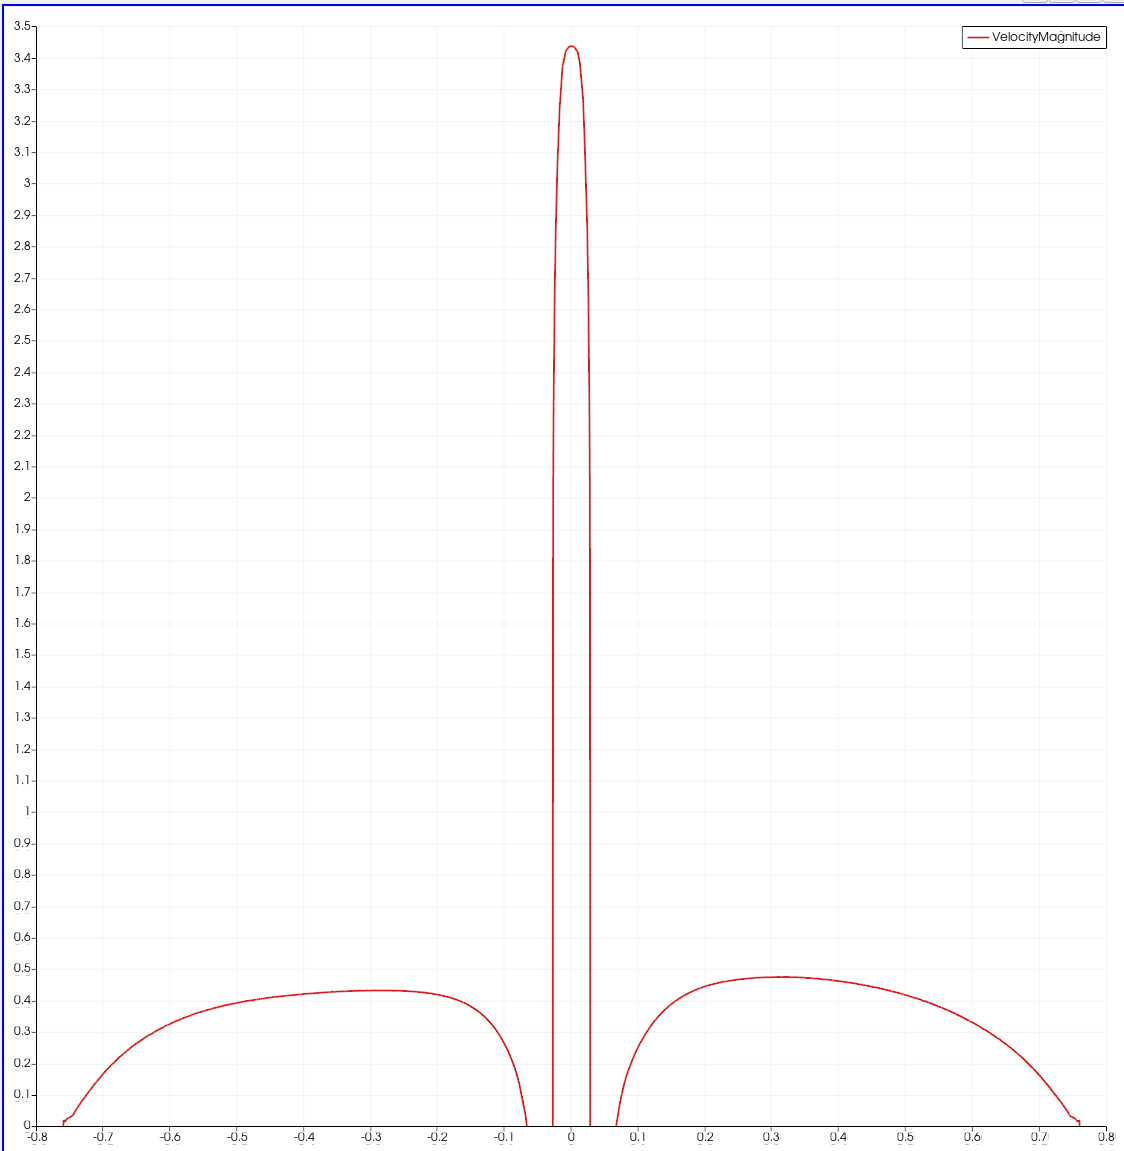
I am trying to plot a curve where the y-axis represents the velocity magnitude, whereas the x-axis represents the x-coordinates (image attached). In the properties panel, I can see that a custom range can be specified for the bottom axis, however, it only allows for mentioning a range (i.e. a maximum & a minimum value).
My question is “can I selectively remove the data from x = -0.05 to 0.05 and plot the rest i.e. 0.76 < x < 0.05 and -0.05 < x < -0.76”?