EDIT: problem solved, see edit at the end.
I’m trying to have a sample code output a rendered image using Catalyst. The “simulation” is a simple code that computes a Mandelbulb fractal. It is then exposed to Catalyst using a vtkMultiPieceDataSet (though for now I’m just using 1 block on 1 MPI rank). I’m using ParaView 5.6 on my Mac, and the code is running on a Linux Ubuntu 16.04, where ParaView 5.6 is also installed (compiled with osmesa support).
I first used a Python script shipped with the Catalyst examples (gridwriter.py) to output the objects, then loaded the objects into ParaView on my Mac, added a contour, and generated the corresponding Python script (render.py) so that the simulation would do the same thing in situ.
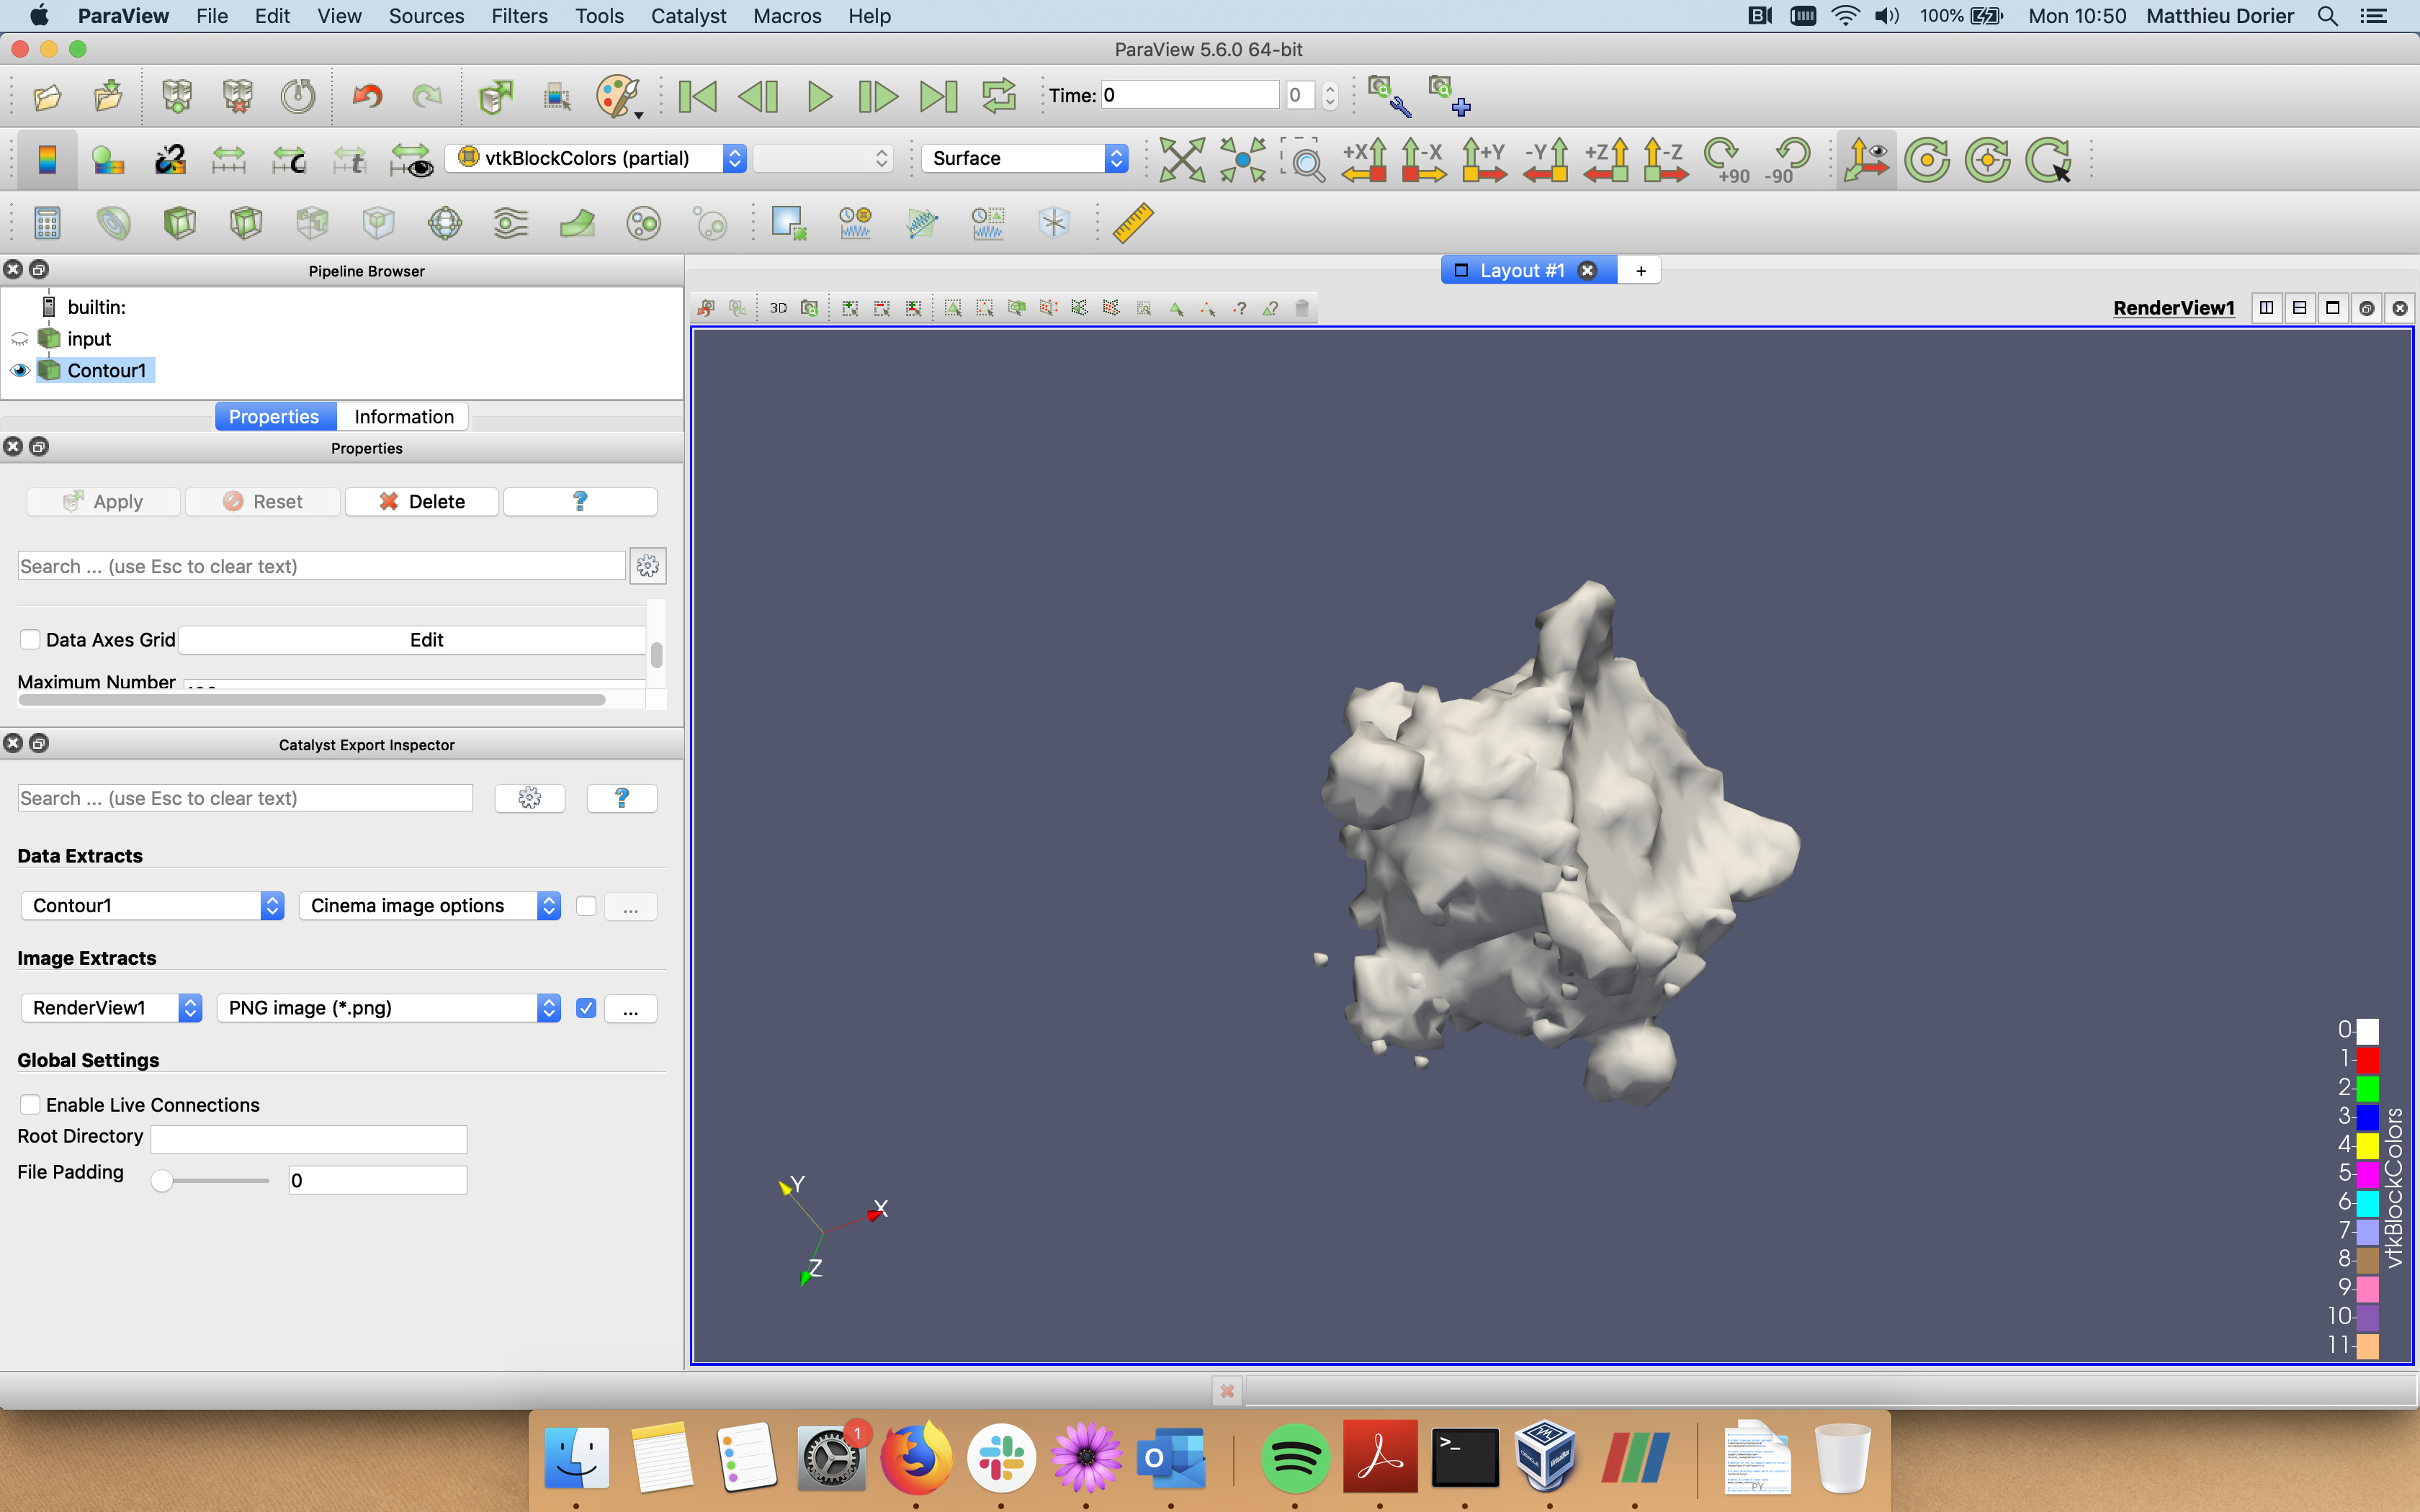
Here is a picture of the ParaView interface on my Mac, with the options I used to generate the Python script:
When I use the script on the actual code to generate the same picture, I obtain the following image:
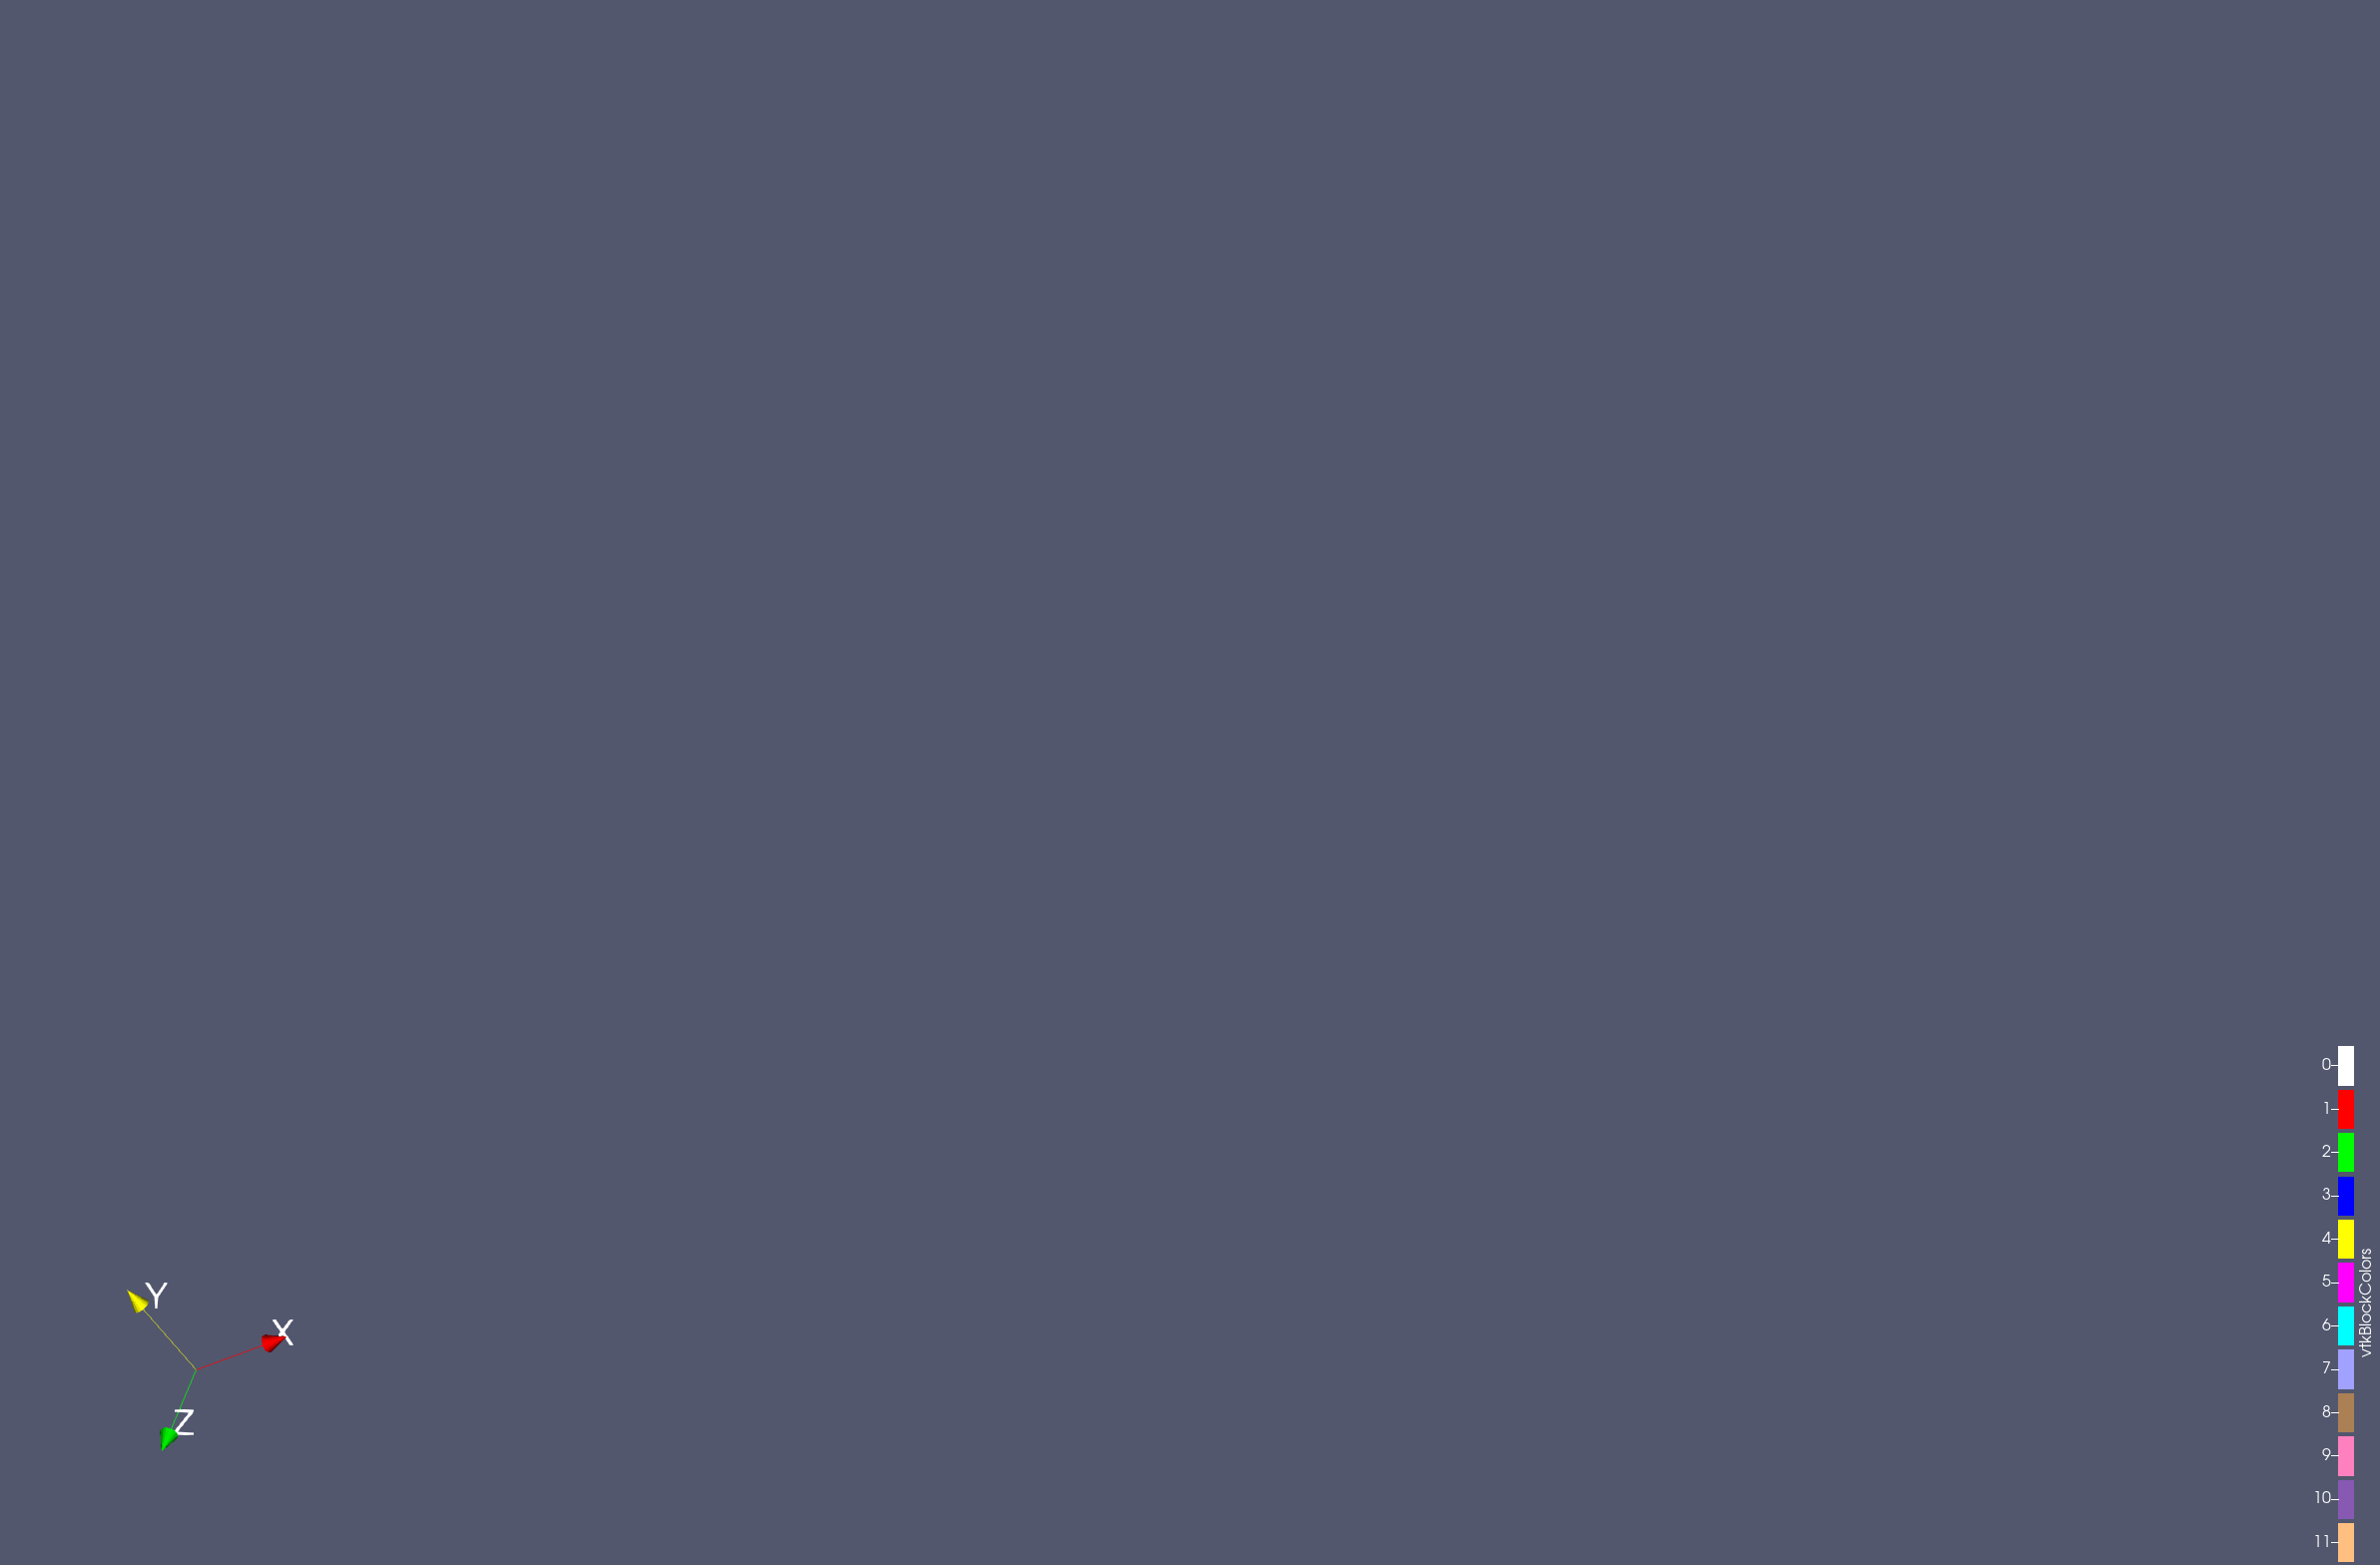
What am I doing wrong?
The full C++ code along with the Python scripts are available here for anyone to try out:
EDIT: problem solved by changing “vtkBlockColors” in ParaView’s drop-down menu to “Solid Color”. I don’t know why “vtkBlockColors” isn’t working, though.