Good day. I’m displaying in Paraview 5.11.1 some .vtk files that comes from cellSets of a openfoam mesh. I use Sources > Statistics Inspector to read the bounding box of each .vtk and manually compute the center point of the cellSet. Happens that sometimes, coordinates are in the order of 1000 in value and the format of displaying is 1 position + 10³ values on this column and does not show enough detail to make a precise calculation of middle value.
Is there a way I can change the # of decimals to be displayed in ‘Spatial Bounds’ ?
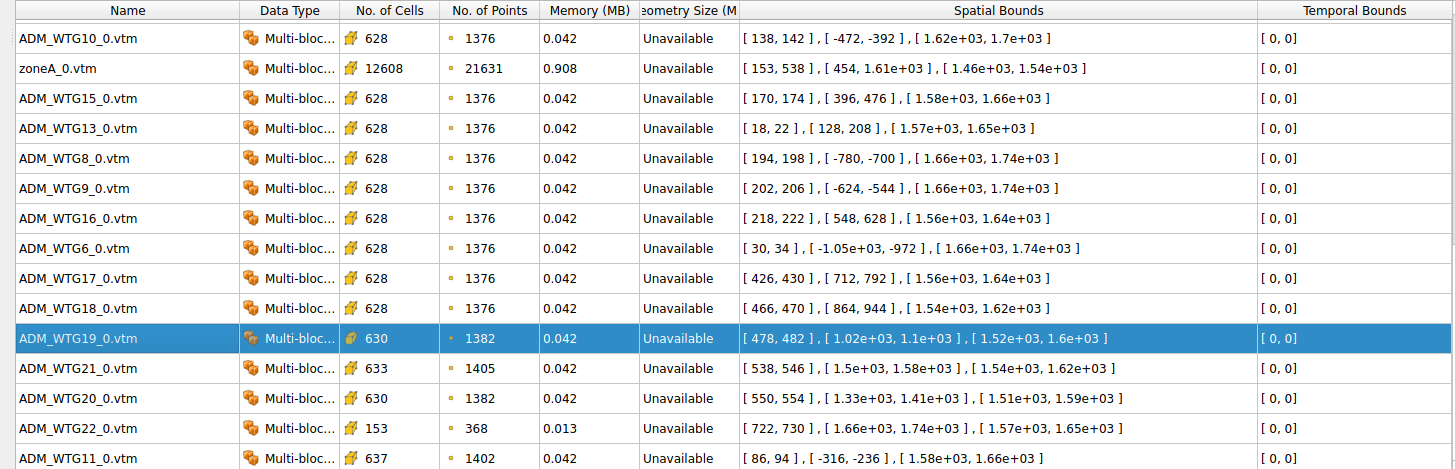
It looks like the Statistic Insptector does not honor the Real number Display Notation / Precision settings. (I reproduced with last version of ParaView).
You may want to open an issue here : https://gitlab.kitware.com/paraview/paraview/-/issues/new
Thanks for reporting!
Hi Nicolas, thanks for sharing the link.
By the way, do you know if there is a way to gather via Paraview using Python (without GIU) the ‘spatial bounds’ of an object? I always do this manually, opening GIU and taking notes of the values displayed, I have not found yet how this task can be automized, any recommendations are welcome.
Yes it is possible!
Please have a look at the DataInformation mechanism 3. Understanding Data — ParaView Documentation 5.12.0 documentation
For future ref, the corresponding issue is here: https://gitlab.kitware.com/paraview/paraview/-/issues/22697