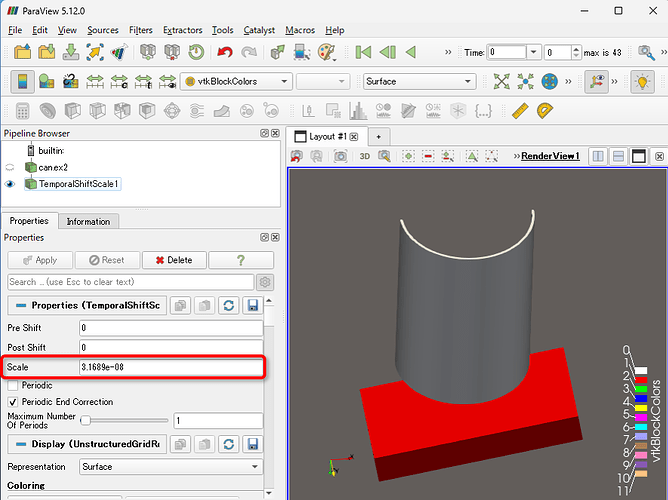
Hello everyone, I’m new to paraview and I have a dumb question. I currently trying to plot the evolution of the bathymetry of a bassin over time. However paraview display my x-axis in second and I would like to have it display in month or year. How can i do that i didn’t manage to find anything about this until now. So to be clear I want to keep the same scaling but I want paraview to display the value divided by by a certain amount withour changing the shape of my graph. I really just want to change the labels.
Thanks for your answers !!
