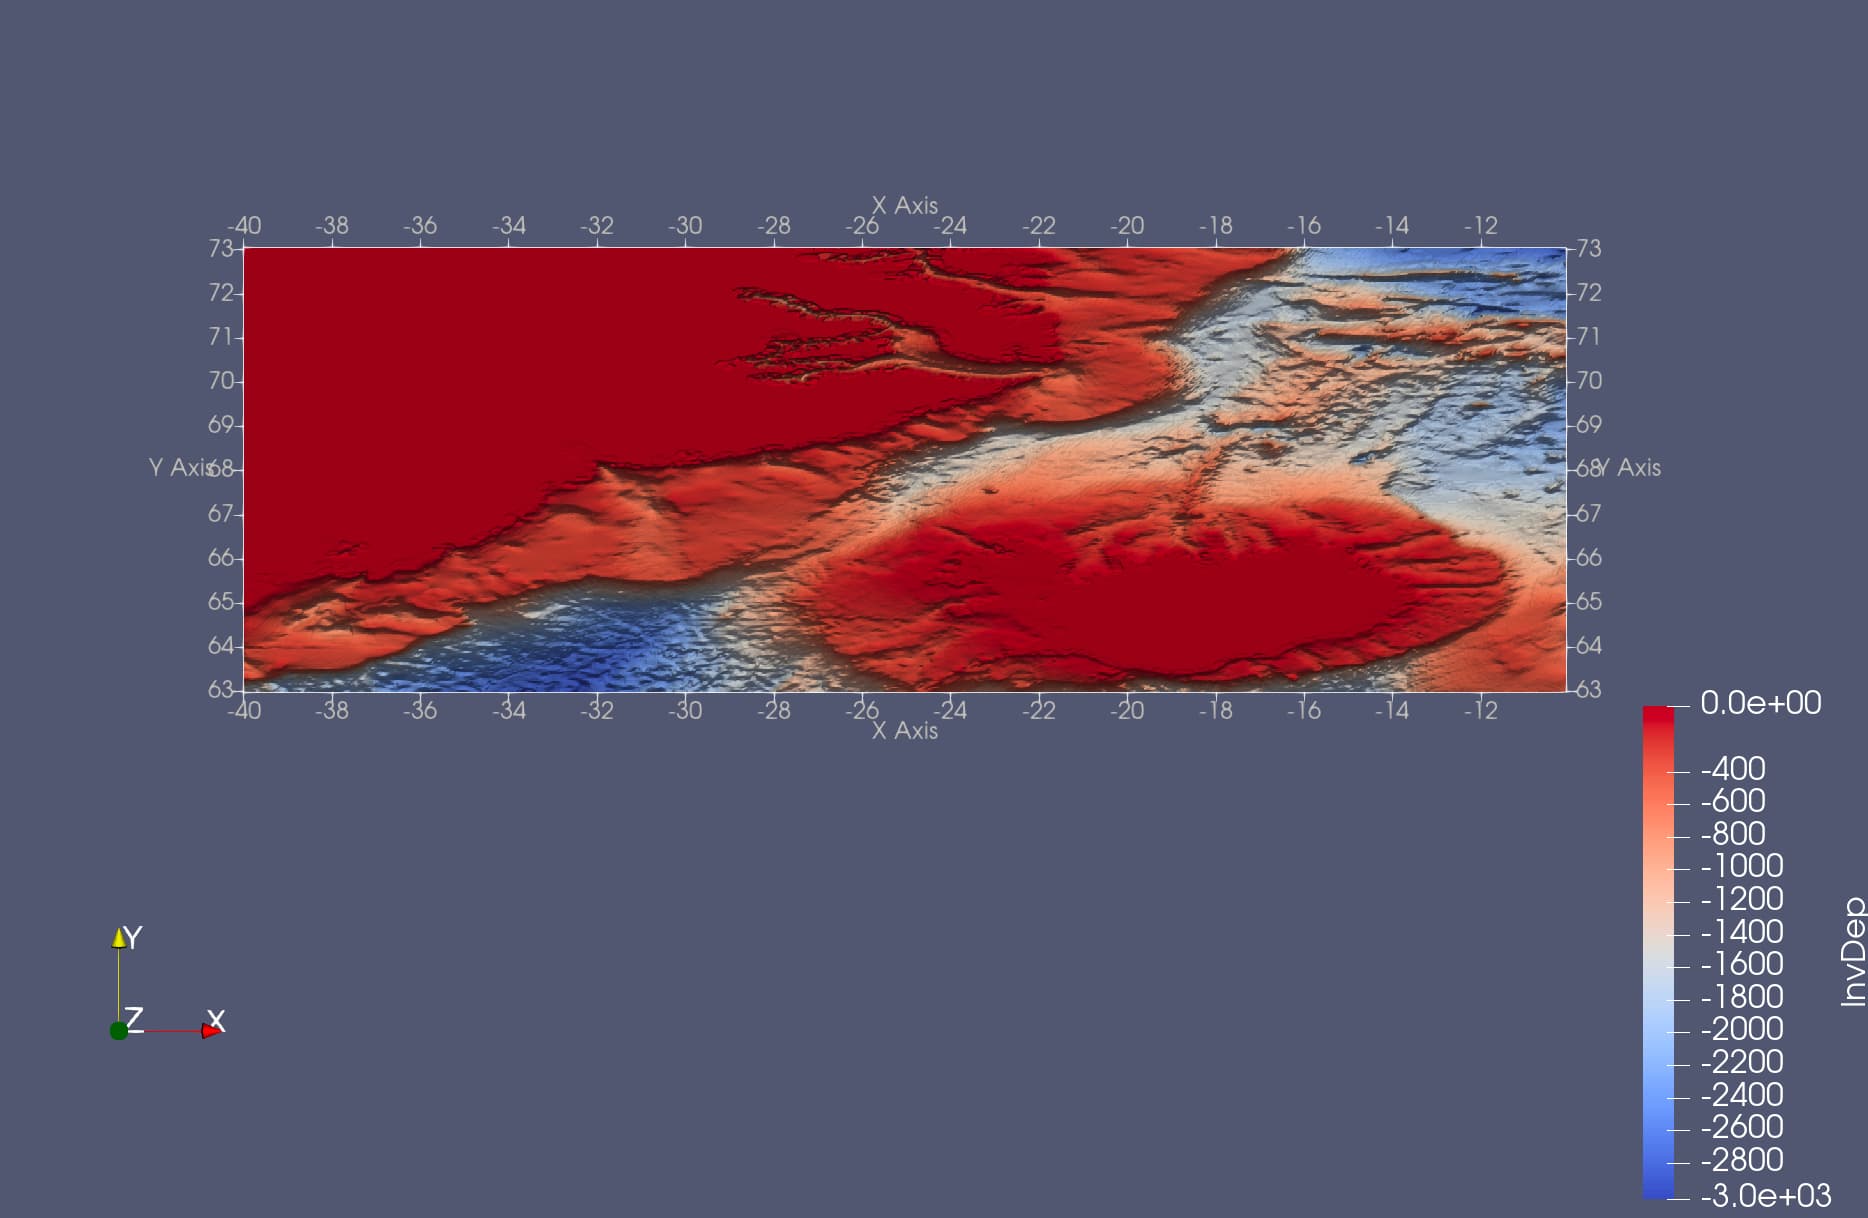
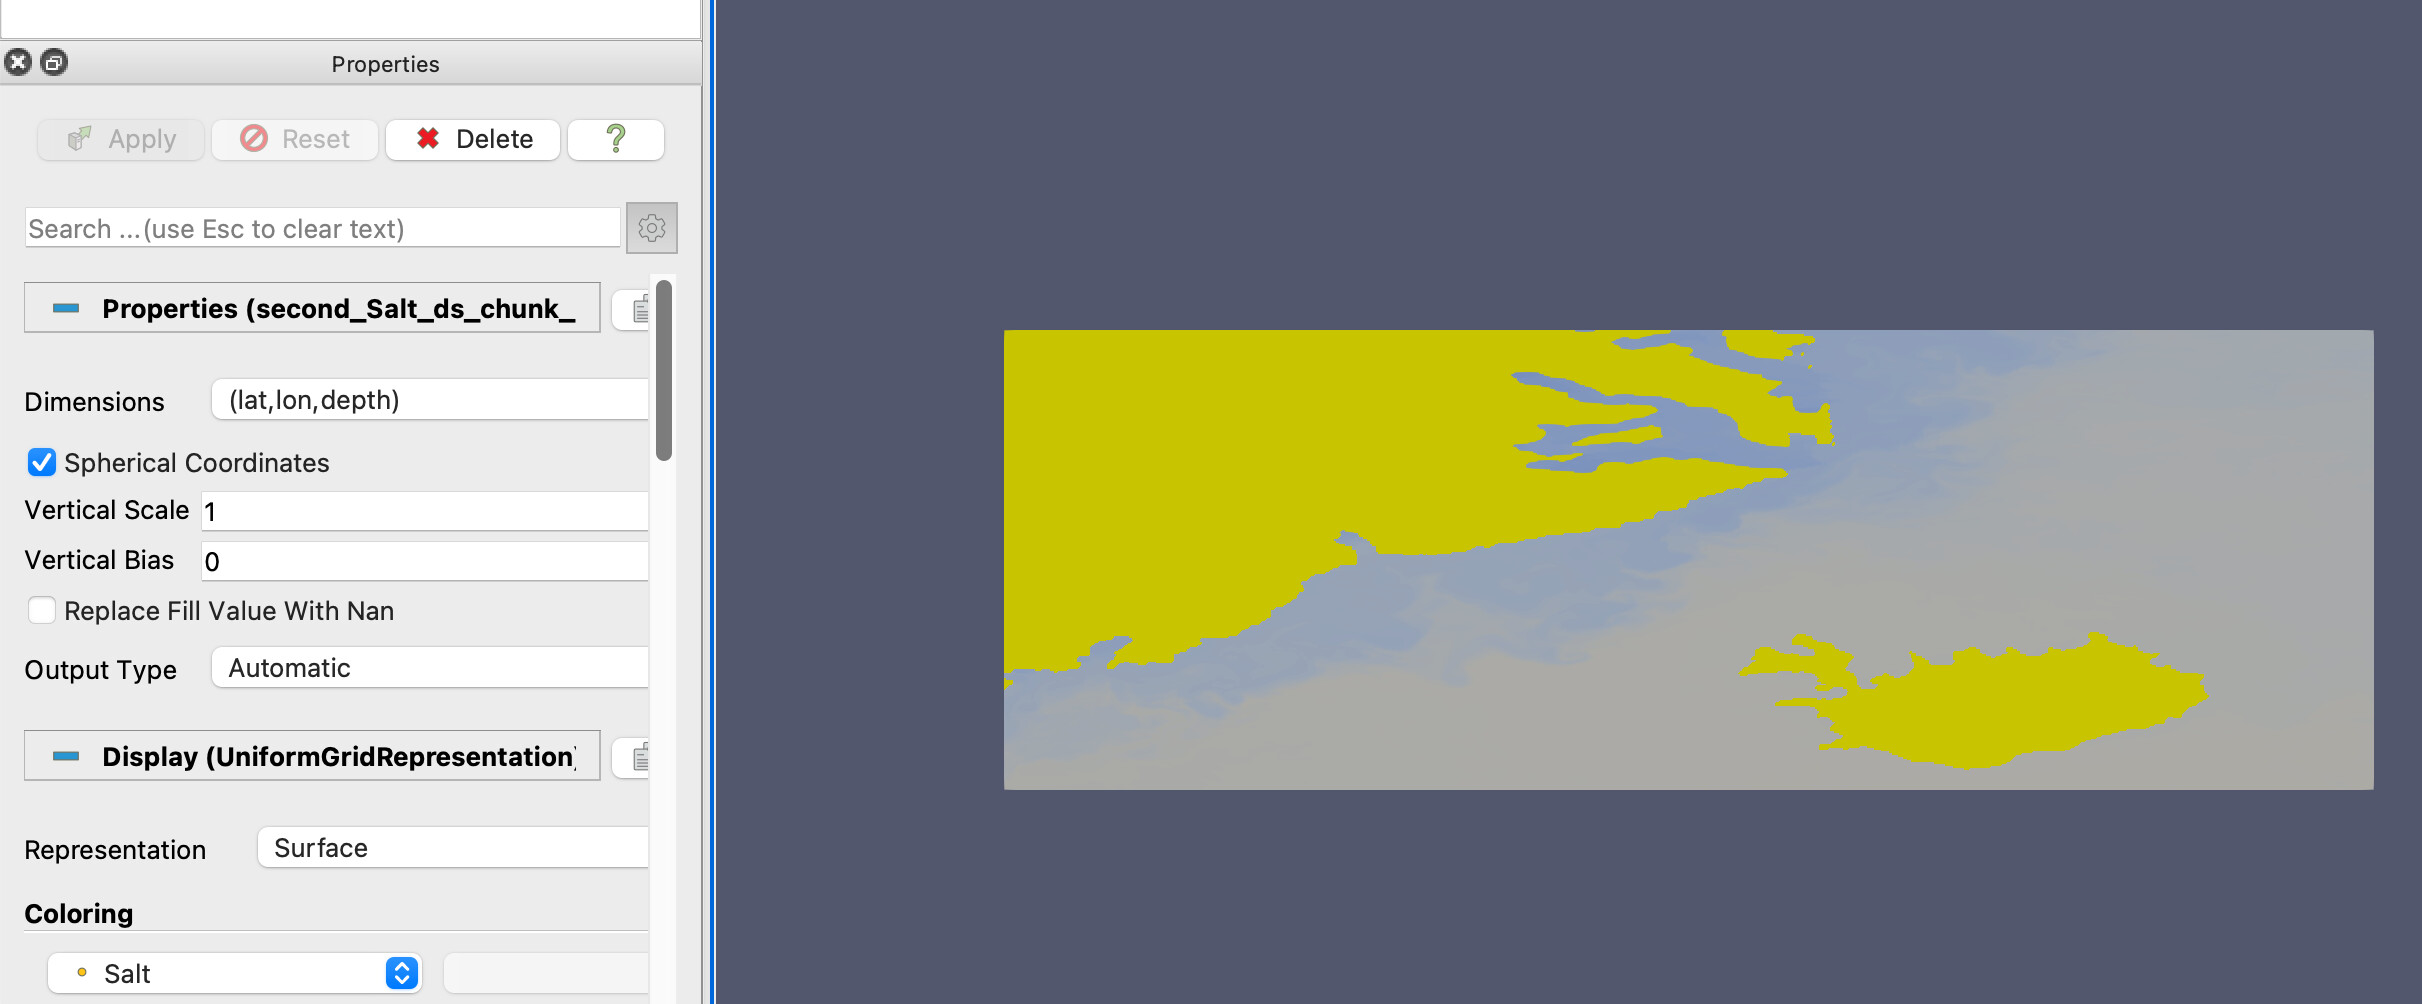
Hi, I have a naïve question: I have a 2D topography (function of lat/lon). I don’t know why it is shown on z-y plane. I’d like it to be shown/oriented on x-y plane so that I can overlay another variable on top of it.
(I have a 3D salinity data that I like to plot on top of the topography. The data has its lat lon along y/x and z as depth. So I like to change the topography from y-z plane to x-y so that I can show the salinity on top of it.)
I played with axesGrid option from this page, but it only seems to change the lables and not the plane of data.
I was wondering if you could direct me how to change the data orientation? I attached two figures to go along with my description above. Any help is appreciated! Thank you.
h