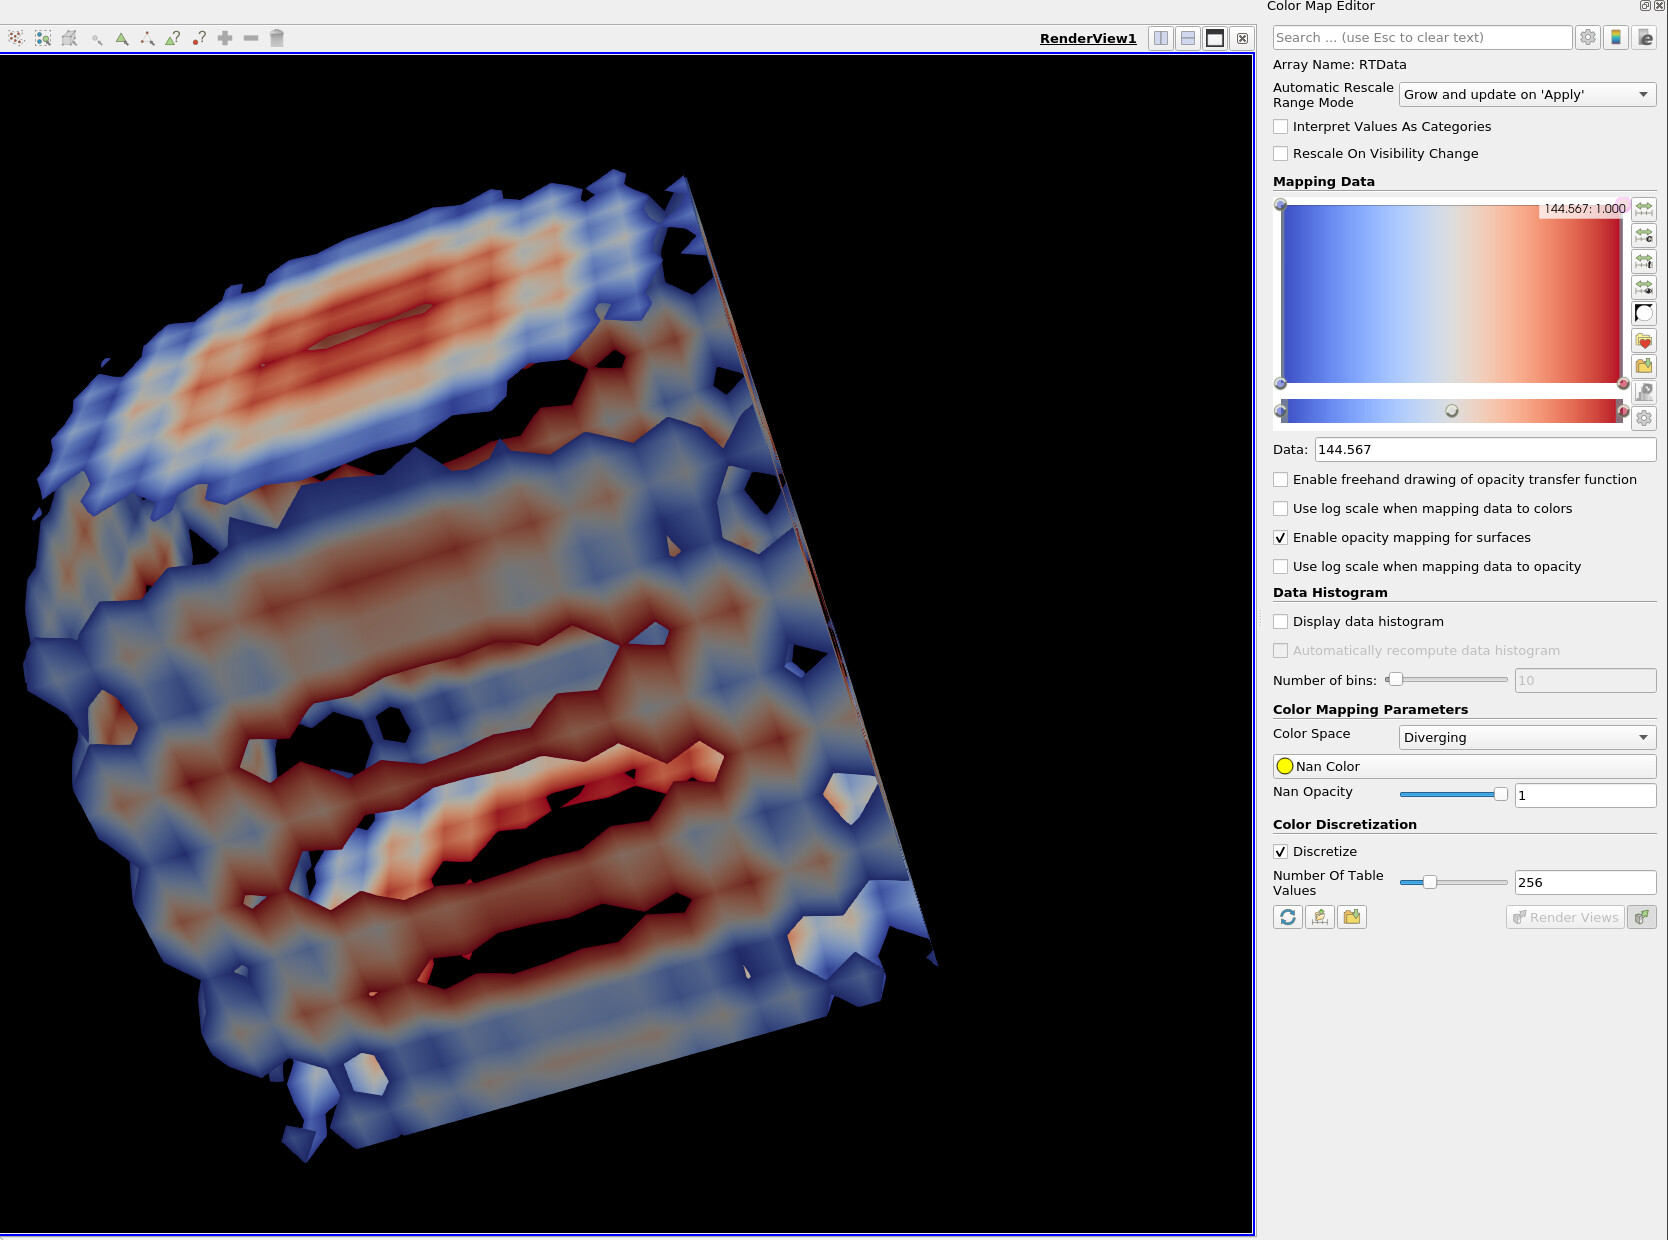
In the post-processing packages for commercial CFD codes, there is often a feature where you can “clip the colour scale” on a contour plot, so that values that are off the end of your defined legend scale are plotted as transparent. For example, if my legend scale goes from 0 to 10, red to blue, then areas of the contour plot that have values 0 to 10 will be coloured, values less than zero or more than 10 will be transparent (if I select the clipping feature).
Is there such a functionality in paraview?