In previous versions of Paraview, when a vector field was used as the active attribute of the Glyph filter, it was possible to color the glyphs by the vector components - you would just select “GlyphVector” under the Coloring section of the Display area, and then choose whether you wanted the magnitude or the x, y, or z component to be used for the colormap.
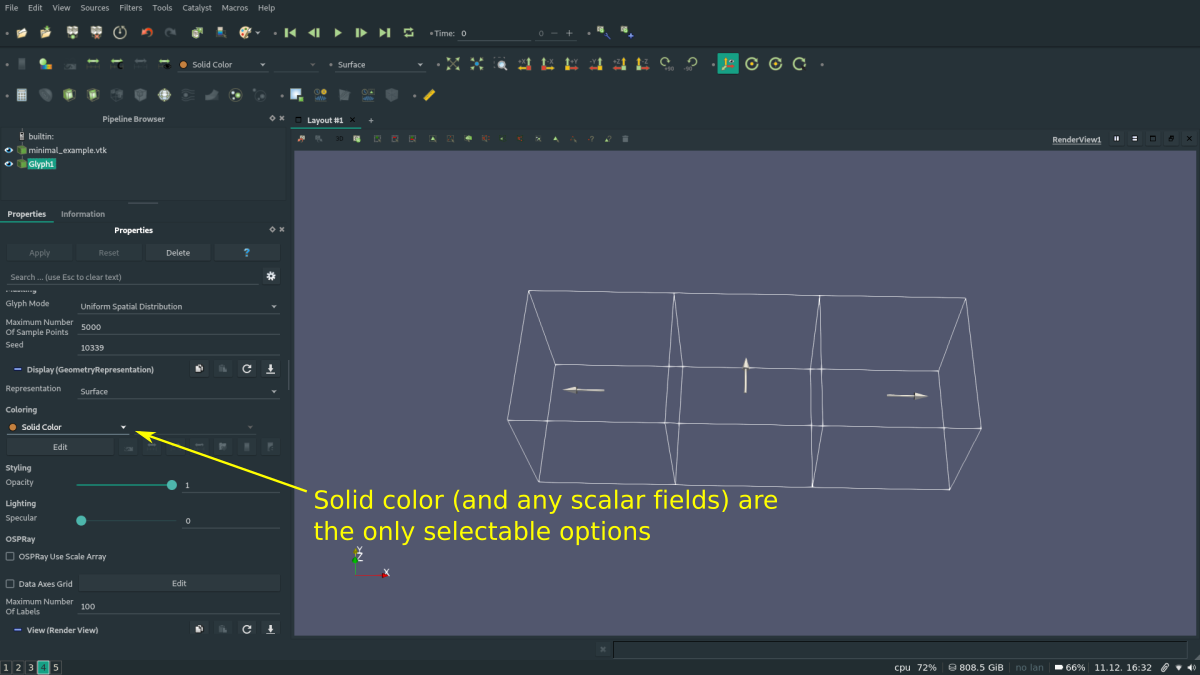
After the release of 5.6, the properties tab of the Glyph filter has been modified, and these options are no longer possible. Using the same dataset, only solid colors or scalars are available for coloring. How can I color a glyph filter by vector components from an input dataset?
You are right, the “GlyphVector” has been removed from the output of the Glyph filter. However, it was a copy of the vector field used for orientation. That vector field is copied to the output of the Glyph filter, so whichever vector field you use as the Orientation Array can still be selected in the “Color By” popup menu, and you can select the component for coloring.
Okay, then this really seems like an issue with me, not with paraview. For me, I can select the input vector field for the Orientation Array but the same vector field is not available for the coloring. Here’s a minimal example input file, with 3 vectors stored as cell data:
Ah, you’re right. Thanks for the detailed report and test data set. The cell data array used as the “orientation array” is not copied over to the output, in contrast to point data arrays, which are copied if set as the orientation array. I’ve opened an issue for it.
Hi, I have the same problem here with Paraview 5.7.0 on MacOS. When will this issue be resolved?
I use point data, no cells. I can set my vectors as orientation array, but still they do not show up as option for coloring. With the same dataset and Paraview 5.4 on Ubuntu it works fine.
@mathieu, actually this has been funded and scheduled. 18662 . It is scheduled for this coming fall, although I bet it slips into 2021. As you state, if @piet or @guatavita want to work on it, that would be great!