Hello,
I made this geomodel that visualizes the UCS data.
But the color legend lable is weird.
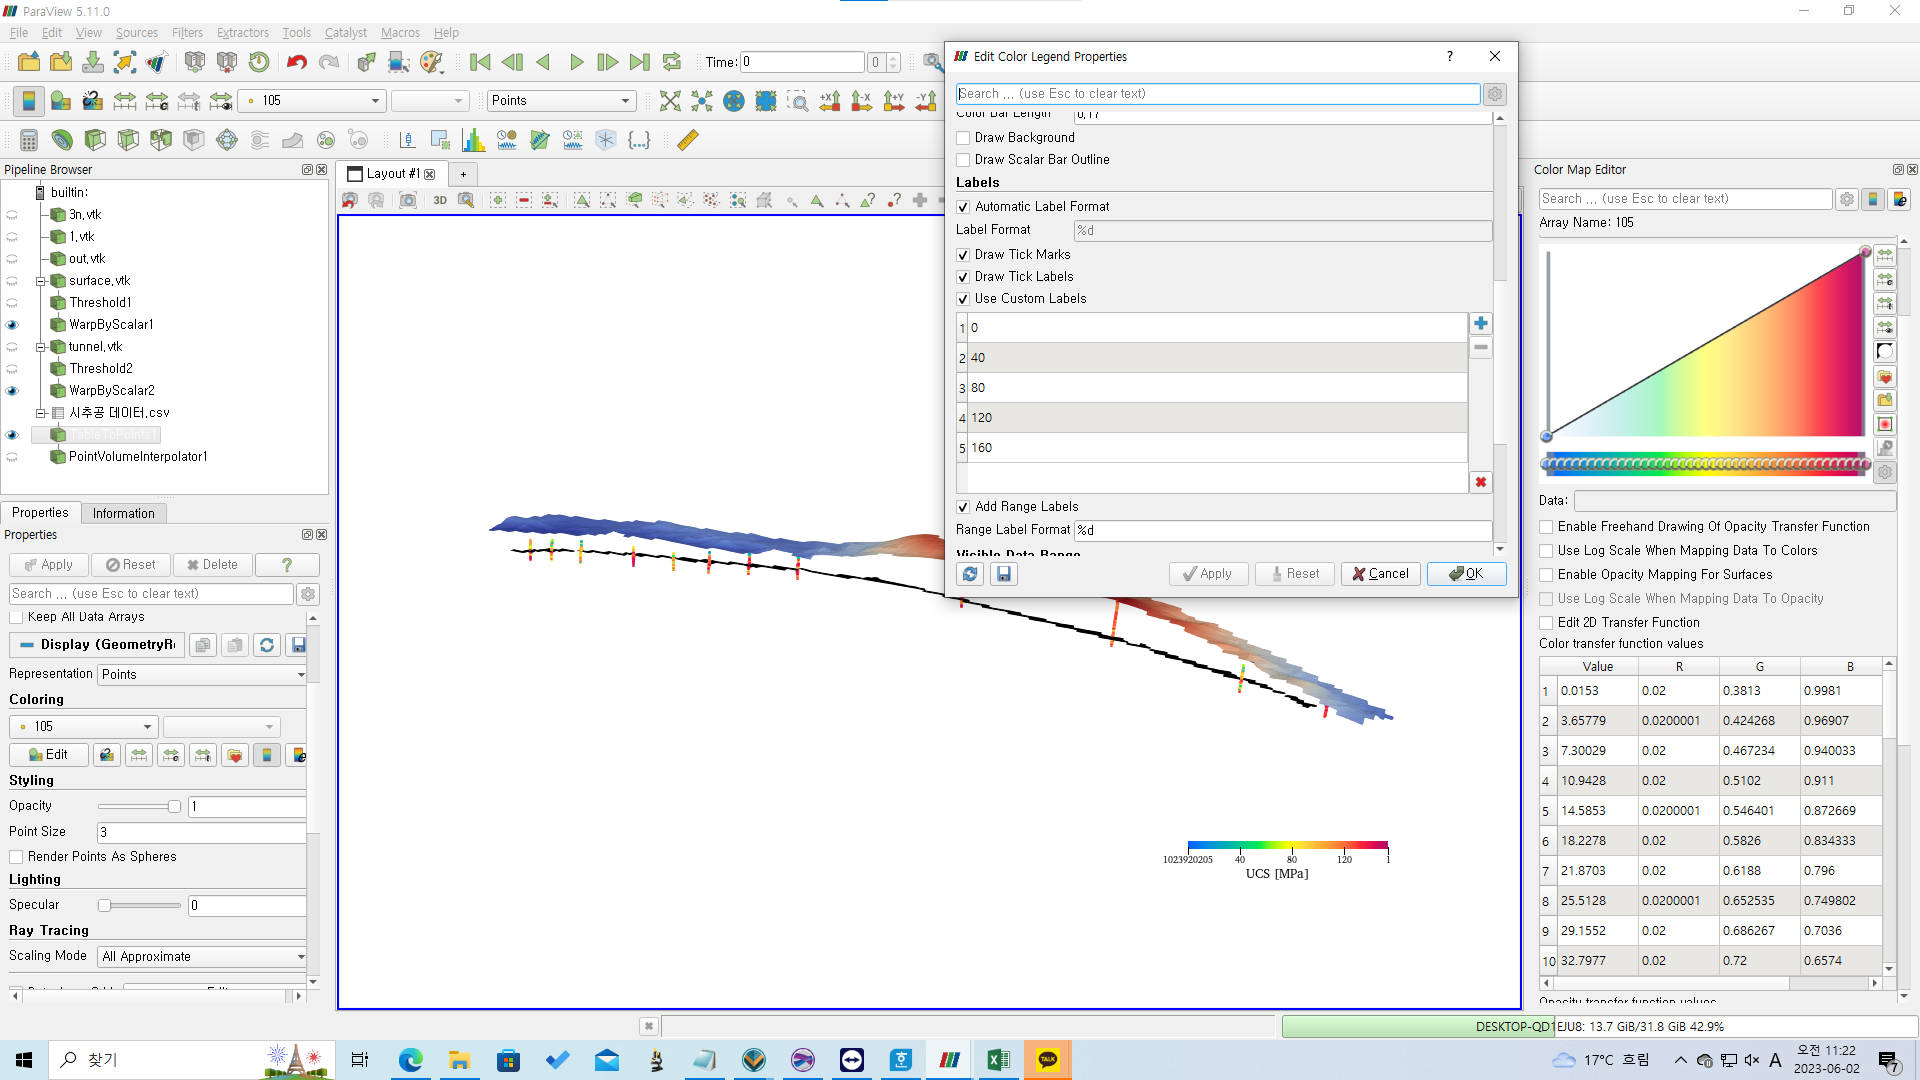
The UCS data range is 15~150(MPa) and I customed the lable like this.
However, in the color legend lable, the minimum value is 1023920205 and maximum value is 1.
Could you please help me to solve this problem?