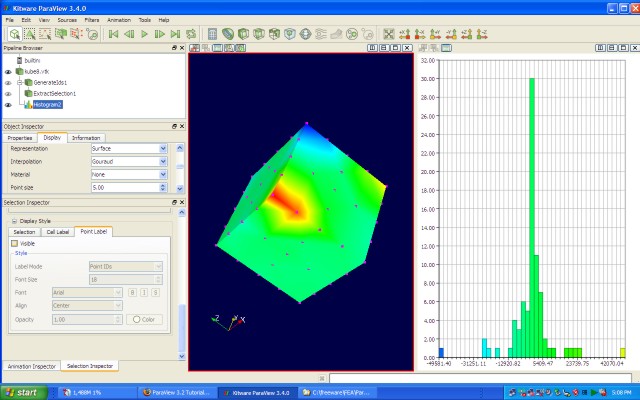
I am trying to plot a histogram in which the bars are colored according to the x-value. It seems like this has been possible in Paraview at some point, as for example in the following image (from Paraview 3.4.0):
However, it looks to me like the only available option is to use a solid color now. Is there something I am doing wrong? I have tried both generating a histogram with the Histogram filter and using a histogram view. I have also searched in the documentation, but there is not much information on histograms.
Thank you!