Hi
I have streamlines on the surface of a cross-section both clockwise and anticlockwise rotating. I want to color it differently according to their sense of rotation, red for clock, blue for anti. How can i do it in Paraview?
thanks
Please share your data and an illustration of what you want to do.
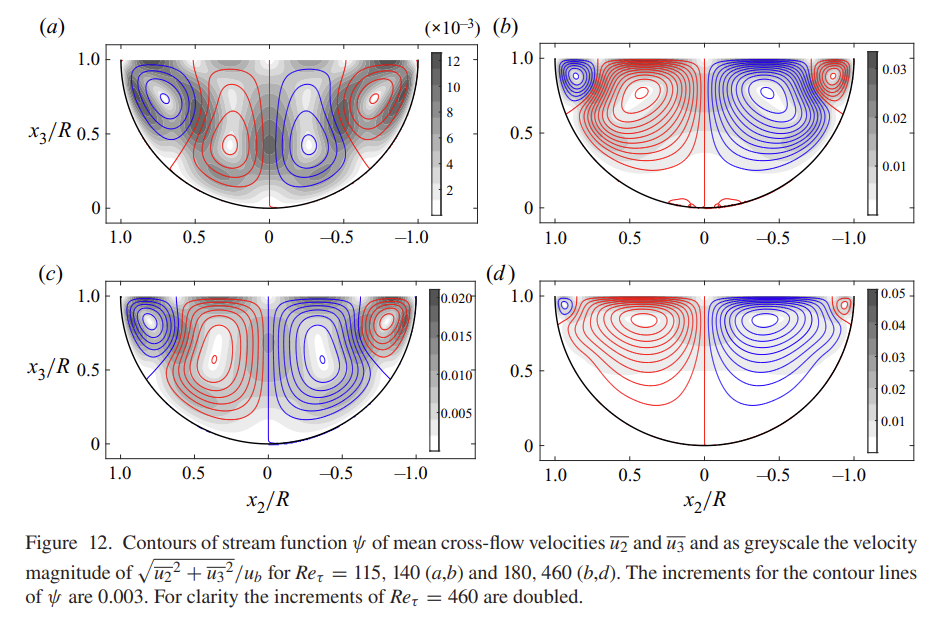
Hi, I have just shared the data called Surface Streamlines via WeTransfer. I want to plot the streamlines with y and z component of velocities on a 2D cross-section of the pipe. But colored according to sense of rotation exactly like the picture below. The corner streamline on the c/s should be colored by one color and the core one with another color. Attached picture.
Use Contour filter.
But for the streamlines dont we have to do surface vectors on a slice and then do glyph? But i do not know how to color the streamlines differently. Those are not contour lines but streamlines..can you please explain a bit more, thanks..
Ha sorry, I missed that you need streamlines. I’ll investigate with your data.
Yes, they have done by plotting contours of streamfunction which also gives streamlines but i am doing in using glyph on surface vectors on a 2D slice. Otherwise i need to define the streamfunction seperately again..
Hey did you have a chance to look at it? thanks
I’m afraid I dont see a simple way to compute the sense of rotation of a line. You will need a custom programmable filter for that.
Is doing the custom filter very complex? means how to do that?
Its not easy, but its not super hard either. Doc is here: 5. Programmable Filter — ParaView Documentation 5.12.0 documentation