Composite material visualizations

Hi all,

@spyridon97 and I are starting to work on support for visualizations of layered composite materials (such as carbon fiber in a resin matrix) modeled as shell elements with additional information about fiber orientations.

The idea is to develop a capability to show both

  • stress-tensor magnitudes (such as the von Mises stress or stresses along principal axes) computed from a simulation; combined with
  • the orientation of fibers within layers

in the same visualization so engineers can understand the relationship between the designed geometry and the computed stresses.

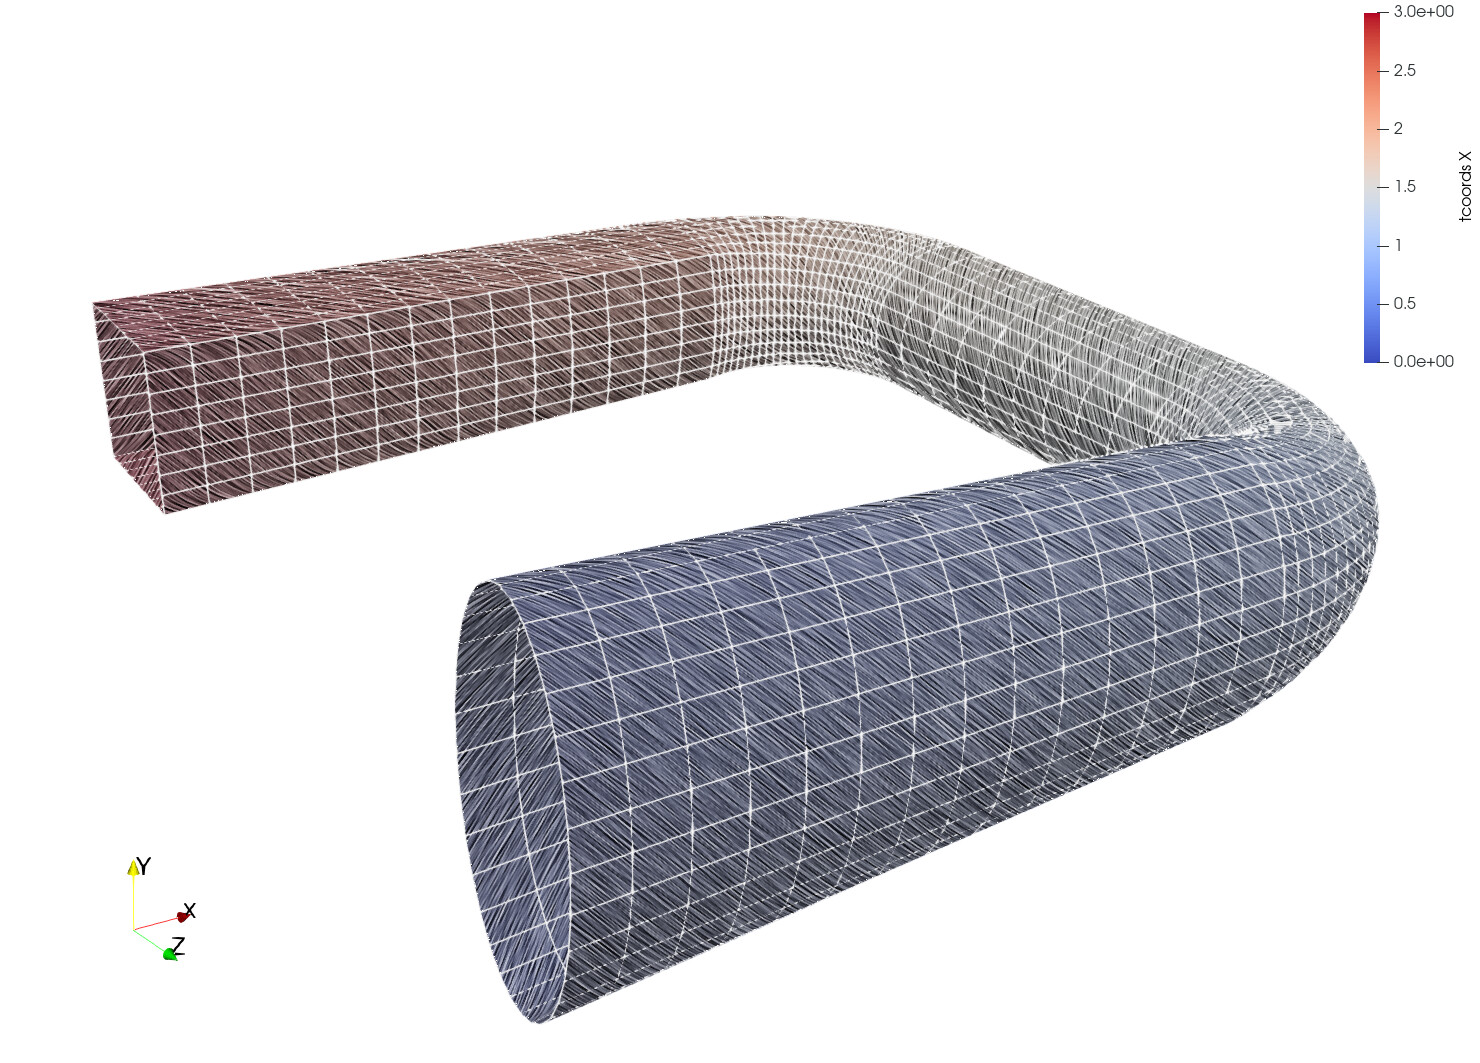
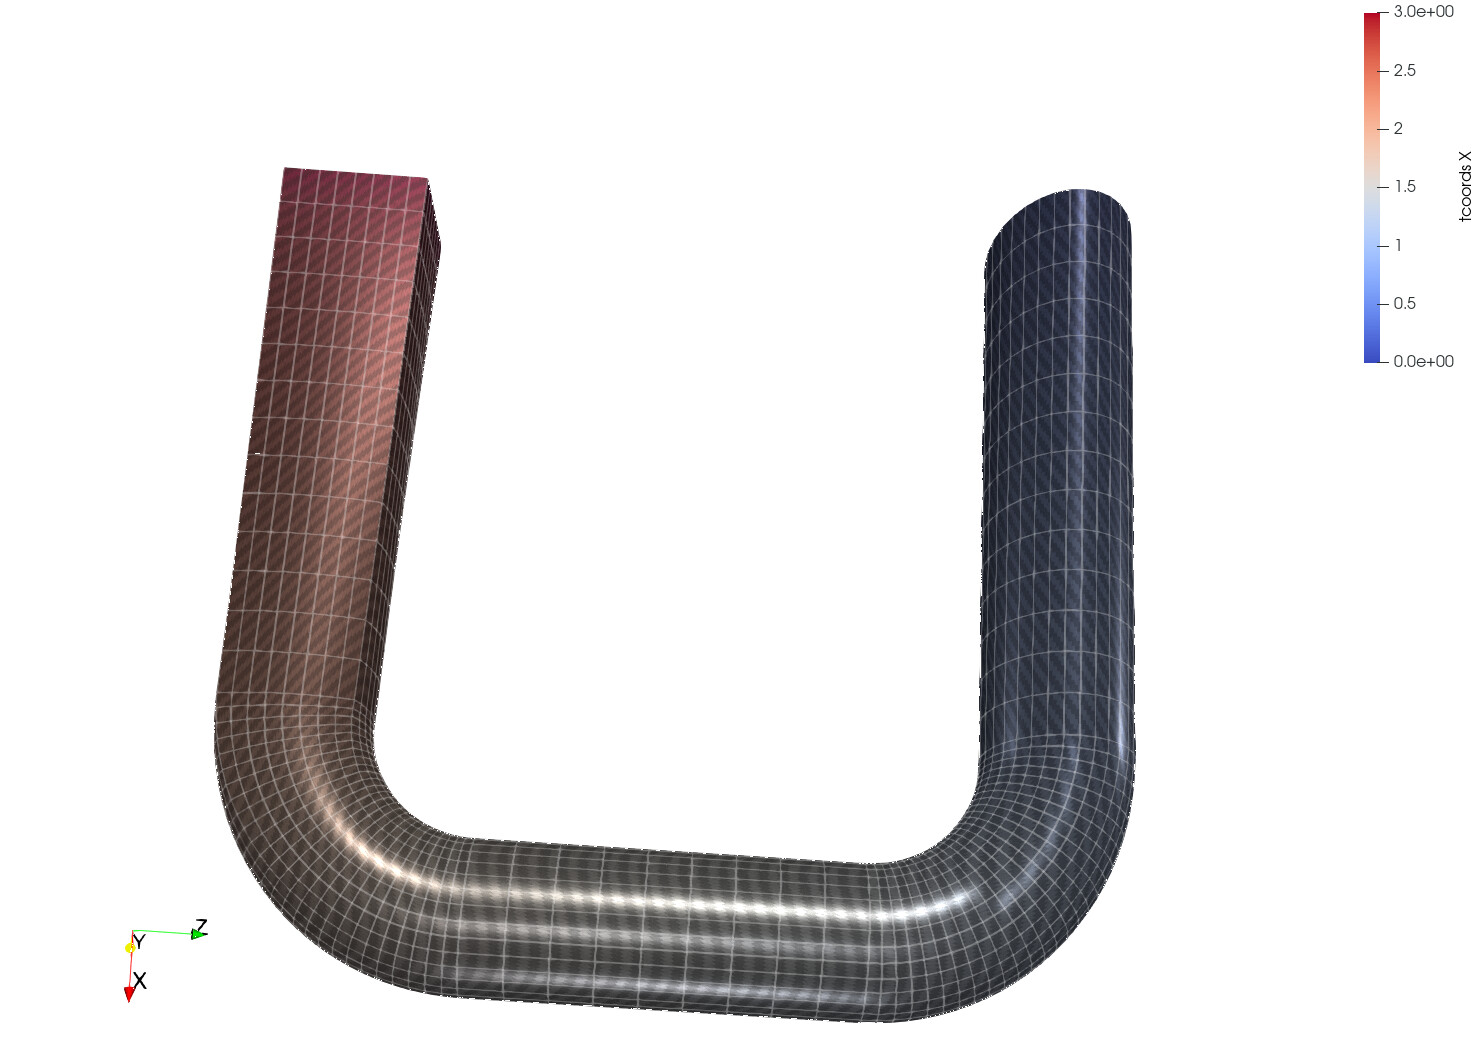
As part of this work, we want to ensure our data model is flexible enough to accommodate the needs of the community. Here is a diagram showing the type of shell data we are currently considering:

  • To the left is a shell element’s parameter space (a 2-d quadrilateral or triangle characterized with (r,s) coordinates).
  • In the center is the physical shape that the shell approximates. You can see it has a thickness (or height) h and that (in this example, not in general) there are 3 layers. The layers of the part do not need to be uniform in thickness.
  • To the right the layers have been “exploded” so that you can see the height of each layer as well as a 2-d vector associated with each layer (d_1, d_2, d_3). Note that the thickness fractions, t_i sum to 1: \sum_it_i = 1.

We assume that the number of layers N is fixed within a block of elements (i.e., many elements in a dataset will have the same number of layers) since this matches how parts are manufactured. (The figure above has N=3.)

The questions we have are:

  1. How are shell-element thicknesses h and t_i defined in your code? Is h provided at nodes, at cell centers, or uniform for an entire block of cells?
  2. How are the fiber directions d_i specified in your code? We assume they will be provided per cell or per point as a pair of values. A single angle \theta with respect to each element’s r parameter-axis is a possibility, but accepting a 2-d vector allows for future expansion or for electromagnetic codes where the principal direction may be perpendicular to the shell.
  3. Besides the variables discussed above, what other information do you provide that might be useful for visualizations.
    • For example, fiber may be woven matting (in which case d_i points along one direction of the weave), a single long filament, or chopped segments with limited directional control. Do you need to indicate/visualize that?
    • You might also have a characteristic fiber size (or diameter) s_i \ll h t_i and volume ratio v_i that specifies the fraction of fiber to resin within layer i. This could affect visualizations as well.

We’ve perused these codes:

but want to see if ParaView users have other formulations that require other data.

We will be exploring visualization techniques that use this information. Our prototypes may or may not use custom shaders, but the final capability will almost surely need a custom shader. If you have example visualizations you would like us to consider, please let us know.

1 Like

From a Nastran perspective the part surface is divided up into different properties, applied to elements, where each property (laminate) has a different number of layers. So if the visualisation is to show data per layer one would need to first select a property (collection of cells) that is being viewed.

  1. A composite property specifies the thickness of each ply in the laminate and its orientation relative to a prescribed reference direction in each element.
1 Like

I should also mention that each ply in the laminate references a material (isotropic, transversely isotropic, or orthotropic) with its characteristics defined according to a main direction (usually a plane of symmetry). It is that main direction which is used to specify the appropriate orientation of each ply in the laminate. Therefore there is no particular need to treat the visualisation of a woven mat as different to any other layer in the composite.

Which part of the data model are you planning to evolve ?

We are not planning to change the data model; plain old point, cell, and field data should be just fine. But we need to understand which arrays are needed and where they may be centered.

Rather than displaying multiple layers it might be better to allow the user to traverse a laminate, possibly using up/down keyboard arrows or mouse scroll, so that only a single layer is displayed at a time.

Some codes provide an offset parameter that defines the composite location in relation to the element reference plane.

See e.g.

  • the Z0 parameter in the Nastran PCOMP: PCOMP
  • the OFFSET parameter in Abaqus SHELL SECTION: *SHELL SECTION

This means that the reference plane of the element is not necessaryly the midplane of the composite (i.e. the dotted line in your center image could be moved up or down).

1 Like

@lukas2 For that matter Nastran provides a through thickness offset for CTRIA3 and CQUAD4 elements as well but I’m not sure that Paraview needs to handle it.

1 Like

Thanks @lukas2 and @todoooo . Currently ParaView renders shell elements as 2-d primitives; but if they model different geometry we may prototype rendering them with their physical shape – in which case knowing about the offset is really useful. Thanks!

Here are a couple prototype images we’ve developed, along with a description of how we generated them and what follow-on work would be needed to “productize” them. In either case, there would also be follow-on user-interface work to make ParaView recognize fiber orientation data and allow users to select a layer to view (perhaps on a per-block basis). Also, neither of the prototypes focused on rendering multiple layers at once by extruding the shell to produce a more physically accurate geometry; based on the discussions we’ve had, that did not seem as much of a priority.

Approach 1: SLIC (Surface Line-Integral Convolution)

We used the “SLIC” representation in ParaView to smear Perlin noise along the surface of the sample part anisotropically. The surface color (the usual cool-to-warm colormap) might encode a stress magnitude. This color is modulated (made darker or lighter) by the smeared Perlin noise. Because the smearing occurs principally along the direction of the fibers, it conveys the fiber orientation. The pictures below show the same part but with “fibers” oriented differently: in the first, the fibers are parallel to the longitudinal axis of the tube while in the second the fibers are wrapped at 45 degrees to the longitudinal axis.


Benefits and Drawbacks

This approach generates nice images but the post-processing code does slow rendering down. It can also be tricky to get the right amount of lightness to see the coloring clearly while also leaving the fiber orientation apparent.

Follow-on Work

If we decide to use this rendering technique, we would need to investigate whether there are ways to improve the performance of rendering and automate the choice of parameters to balance fiber contrast and color perception.

Approach 2: Texturing

This uses ParaView’s PBR (physically-based rendering) extensions to apply textures that simulate carbon-fiber material. Multiple textures can be used (one that modulates the scalar colormap being applied to show stress, one that describes the roughness of the fiber surface, one that modulates the surface normals to produce complex specular highlights, etc.). As such, this allows a wide range of appearances as the two pictures below illustrate. They show the same fiber orientation but with different trade-offs between photo-realism (top) and scalar color visibility (bottom).


Benefits and Drawbacks

This approach is fast to render and produces high-quality images but again there are trade-offs to consider in terms of how easy it is to perceive the scalar being visualized with color compared to the textures used to illustrate fiber orientation. The other drawback is that this approach requires a texture atlas for the part.

Follow-on Work

Texture atlases are not something ParaView can generate at the moment, though some preliminary work has started to make this available. Also, support for transforming the texture (i.e., rotating and scaling the texture image on the surface being textured) was present in VTK but not exposed in ParaView. As part of prototyping, we added this feature to ParaView.

Conclusion

After evaluating the prototypes, we feel that the second, texture-based approach is the best path forward and hope to start implementing features to support this as funding becomes available.

1 Like