Hi,
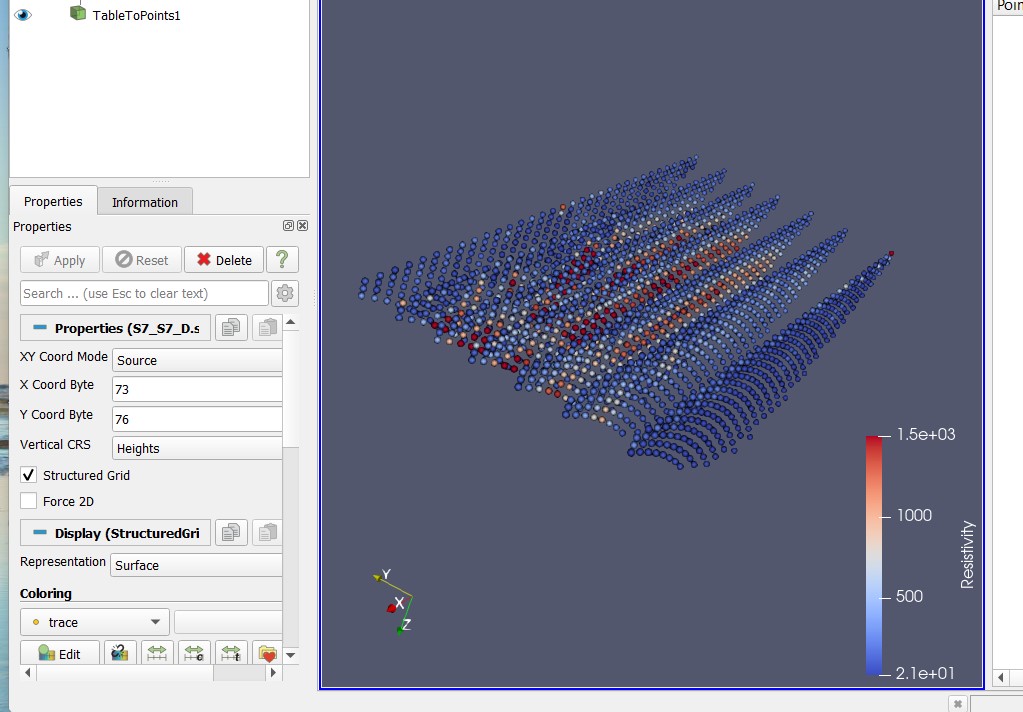
I have several 2D lines and I want to display them together as shown in the attachment. Is it possible to convert points to lines?
Thank you
Hi @Crown
Do you have a way to identify which point is part of which line in the data ?
Are the points ordered ?
Best,
Hi Mathieu,
Thank you for your response. Unfortunately, I don’t know how to identify which point is part of which line.
Regards
Then im afraid paraview cant either
From your screenshot, it should be easy to separate the profiles by their x-coordinate. (I am sure it can easily be done using Python in ParaView. As I am more familiar with code in octave/matlab, personally I would separate the data and interpolate it to something regular, e.g. netcdf, externally. Alternatively, you could triangulate the separated profiles and generate e.g. vtk/vtp)
Hi Mathieu,
I can identify which point is part of which line in the data, what can I do to connect those points?
Thank you
You will need then to implement a programmable filter that uses this logic to ordonnate the points into lines.
https://docs.paraview.org/en/latest/ReferenceManual/pythonProgrammableFilter.html
Hth.
Thank you for your quick response.
Best