Dear All,
I am trying to draw a contour from Octree mesh, which is saved in an Unstructured Grid format(points in vertex, variables in cells. Each cell knows the neighbors ).
Would you give me a hint on how to plot contour wisely?
I am suffering from this problem for almost 2 years. Thus, I tried 3 things:
- Directly plot contour from my source data, As a result, I have holes in my contour plot
- ApplyCellsToPoint filter and then use contour filter, and I observe the same holly picture
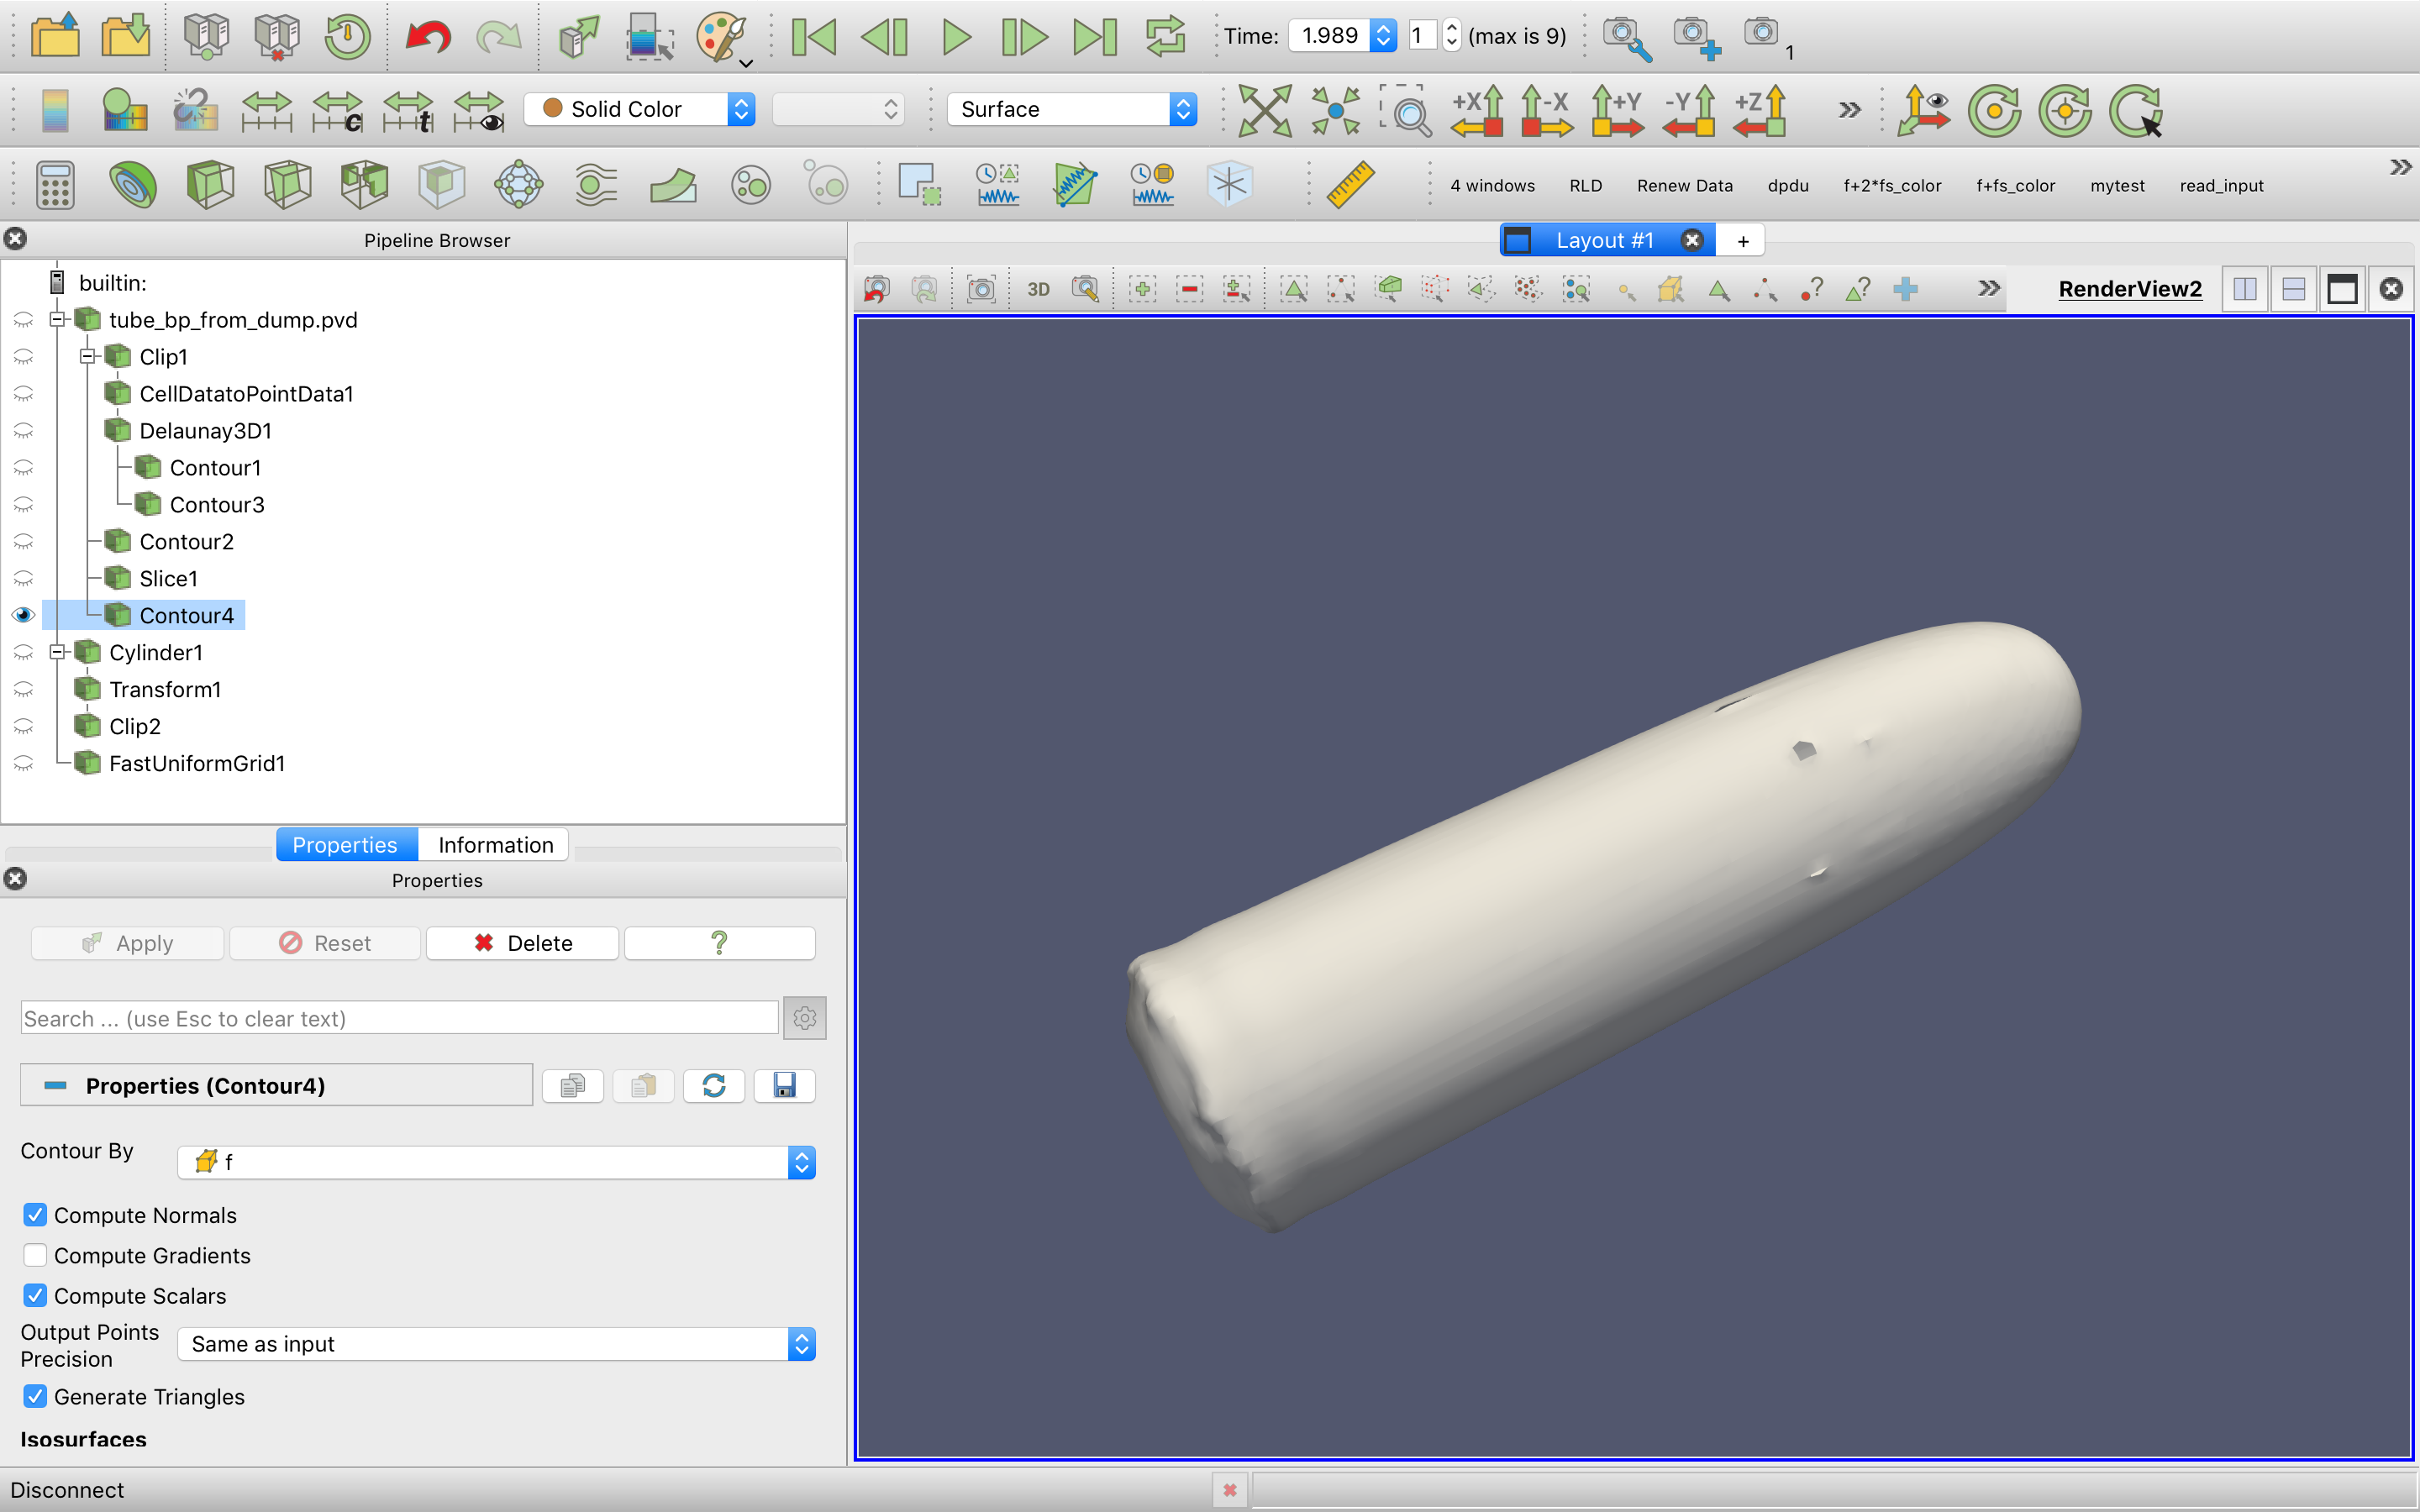
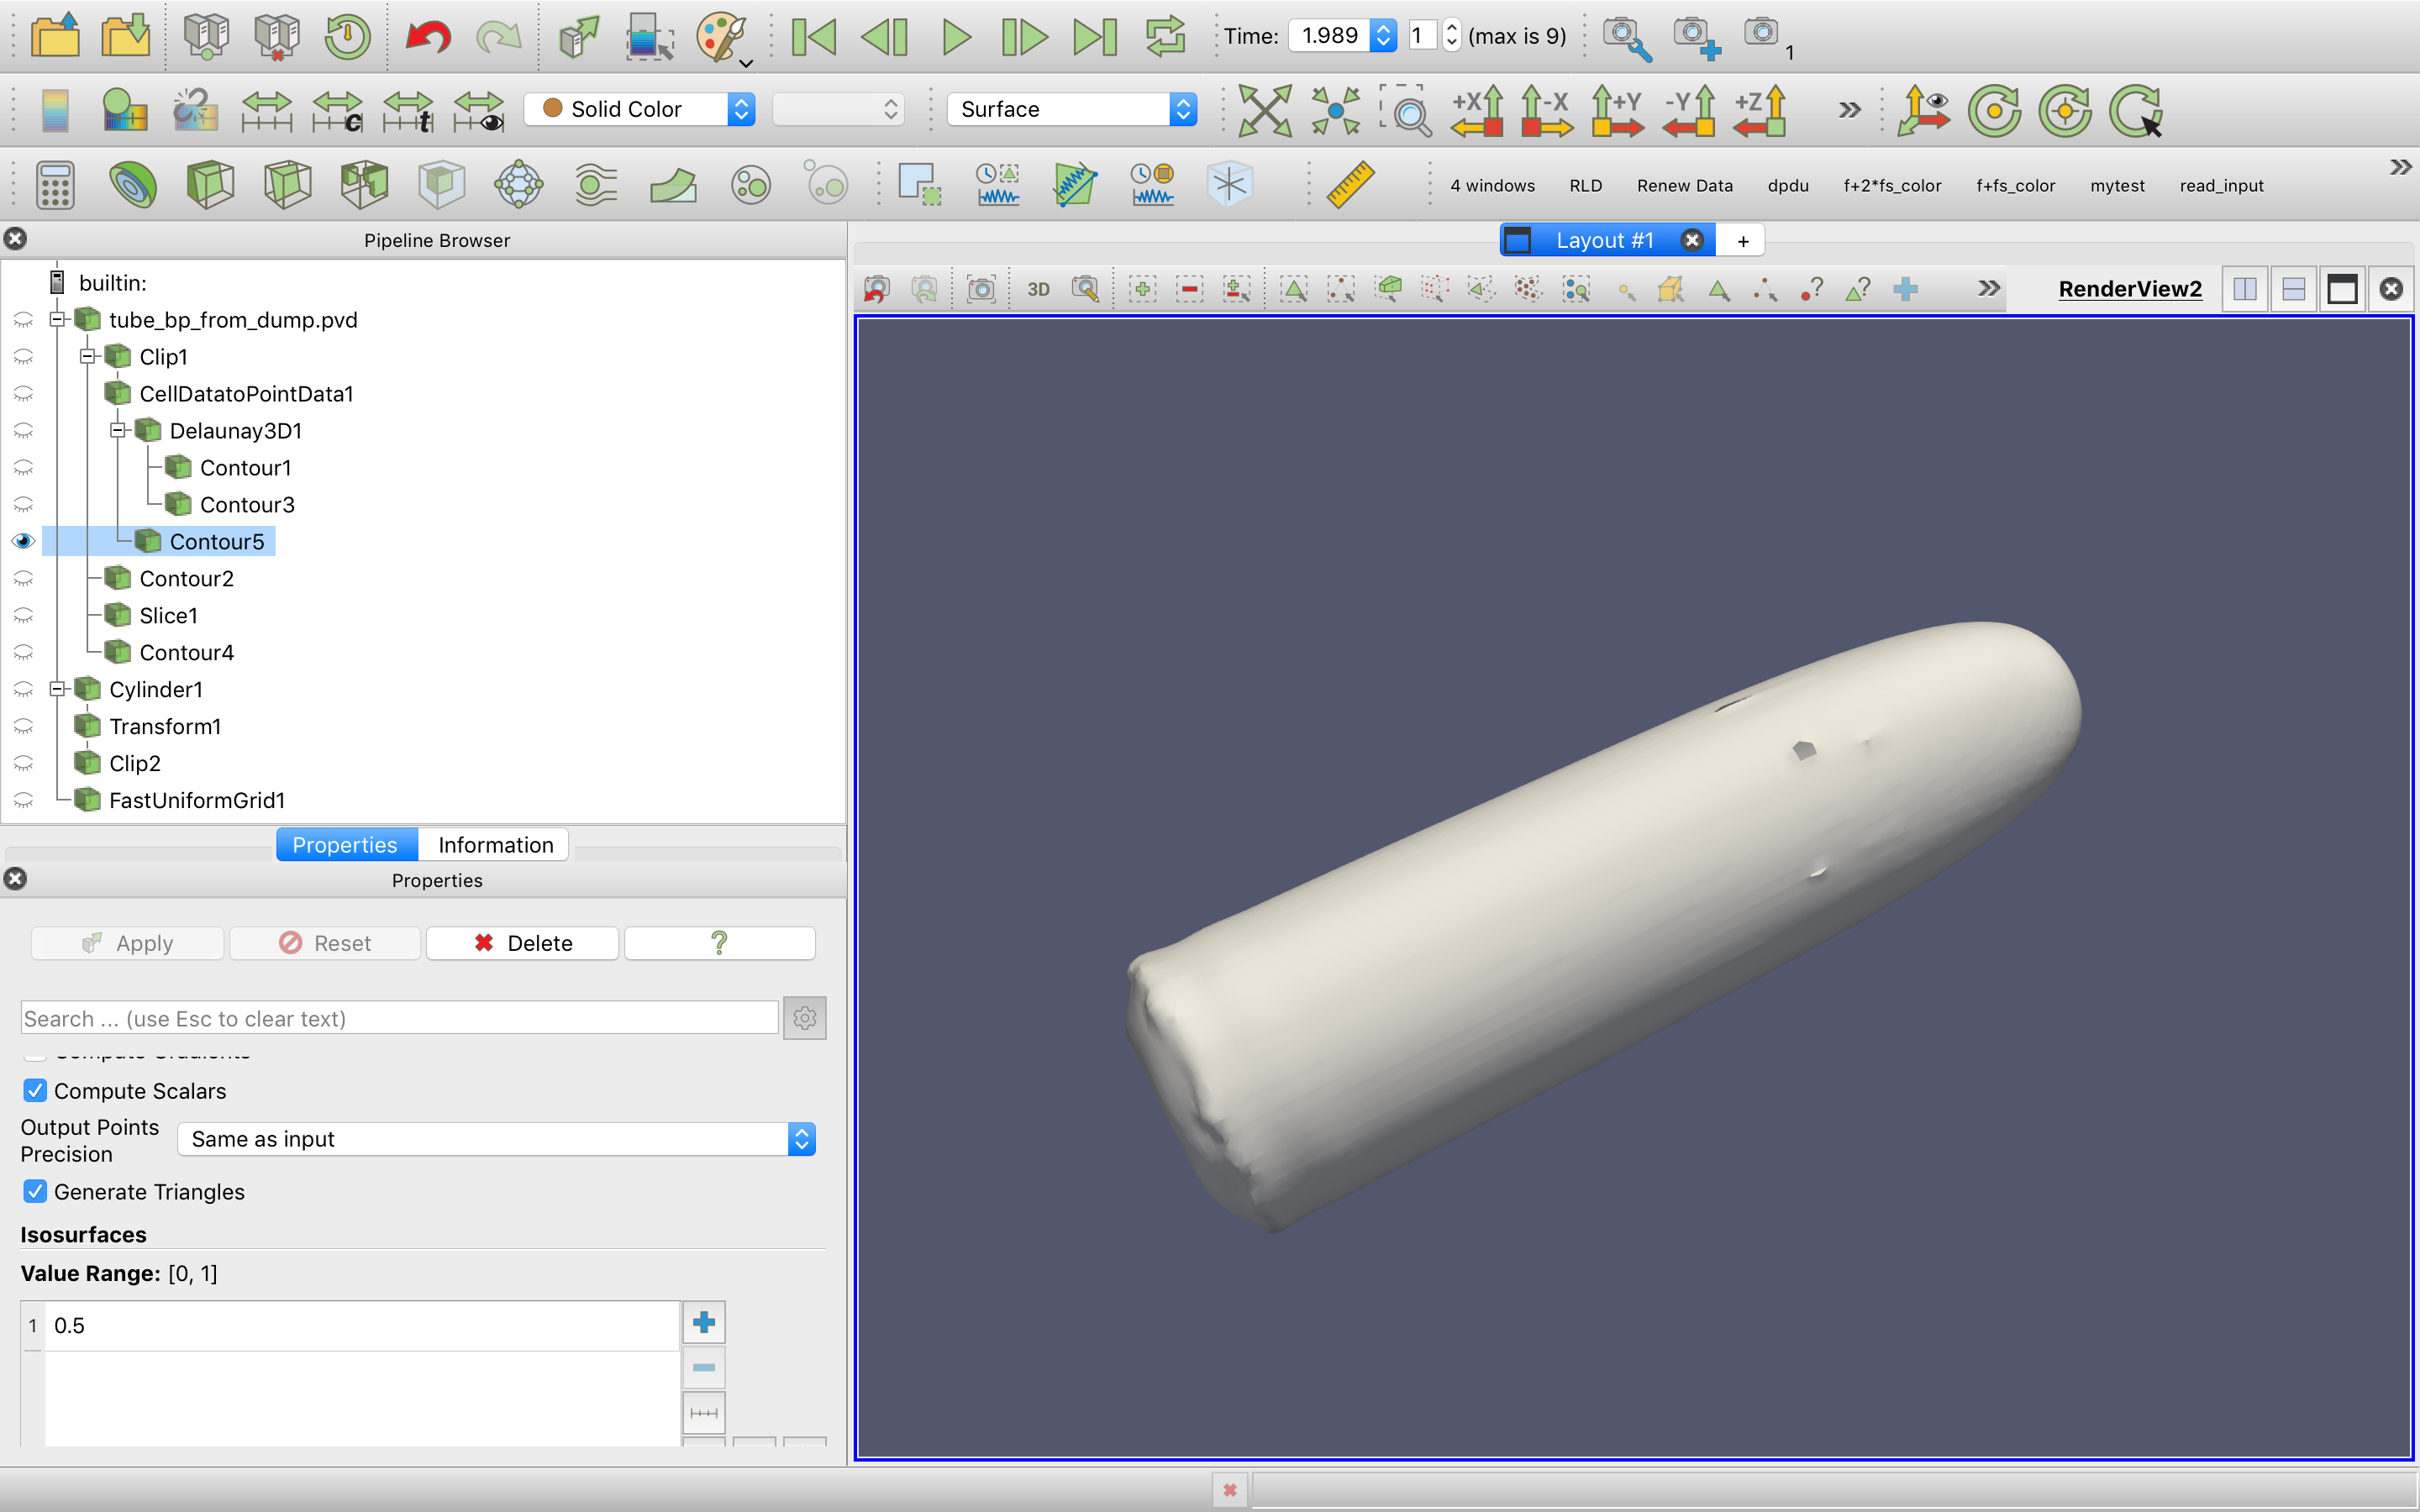
- ApplyCellsToPoint filter, then Delauneu3D filter and then use contour filter, and I see a normal picture:
The only disadvantage of this trick is spending an enormous time for Delauneu3D. I am showing the results on the coarse mesh, but in refined mesh, it takes forever.
Maybe there is a method of how to obtain a coarse mesh for Delauneu3D?

I have a 4th way, but I don’t know how to implement it. The idea is the following: I interpolate my data to the uniform coarse mesh and then try to plot contour. I noticed that such artifacts happen only in a place where a high value of the ratio between neighboring cell size(transition from refined mesh to coarser mesh). What filter should I use to interpolate my data to the uniform mesh? Or it is possible only using scipy, numpy, i.e. outside of paraview?
Can be It done in parallel?
Thank you in advance!
Best regards,
Evgenii
