Hello everyone,
I am using a CSV file to plot data. However, I am getting extra mesh outside the domain. Kindly comment to remove those meshes (outside T-shaped)
Hi,
You can apply Delunay3D Filter to the data with options:
alpha=0.070714, Tolerance=0, Offset=0, Bounding Transformation, Alpha Tets, Alpha Tris. You will achieve this:
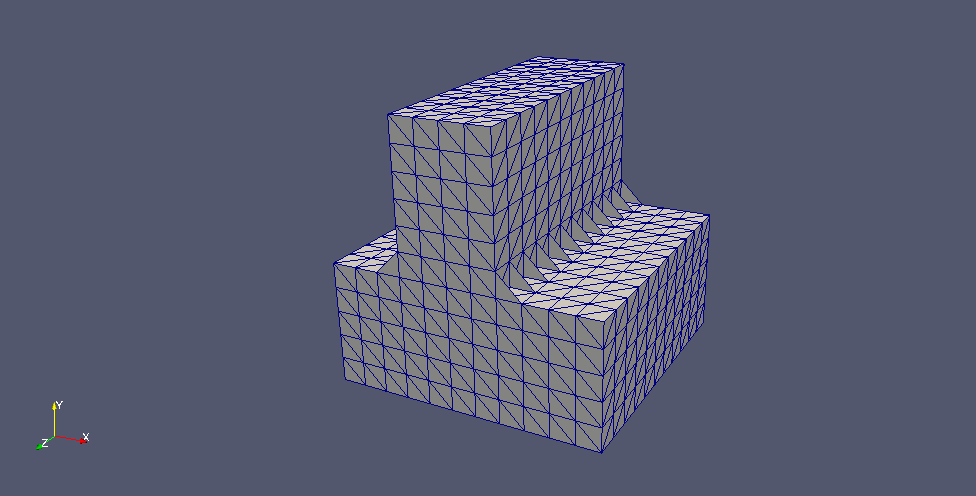
In playing with different numbers or filters you will be able to remove the small triangles (I think).
An option that PROBABLY would work easily is plot data in 2 parts (load 2 sets into the pipeline). In that way Paraview will not be confused in the limits (You can try)
Thanks @Sebastian for your kind support. It helps me to get according to my 3d domain.
Also. is there any method to generate the python script for the same action.
Yes, because you can “record” your actions in Paraview (like recording a macro in excel) to Python. Or generate your own scripts in the window.
Check Cyprien Rusu channel in Youtube, video " Paraview Tutorial 11 Automating Paraview Tasks with Python Script"